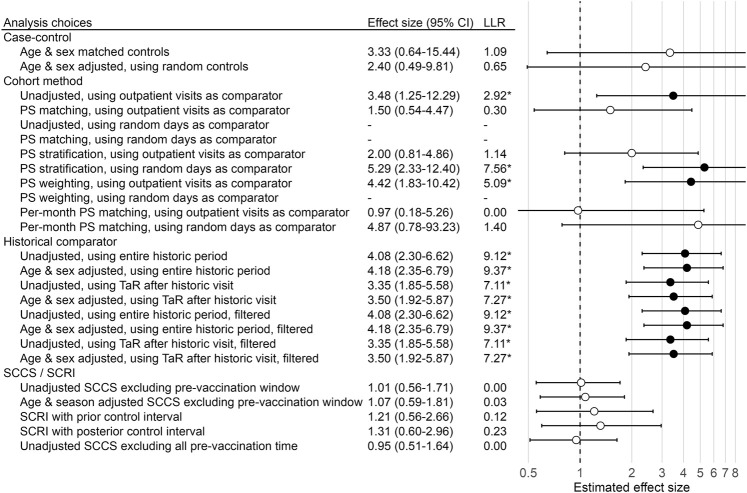
FIGURE 1.
Effect size estimates, 95% CI, and LLRs for one example control. We use each analysis variation to estimate the causal effect size of H1N1pdm vaccination on the risk of “contusion of toe” in the Optum EHR database, using the data across all 9 months. The true effect size is 1, as indicated by the dashed line. ‘*’ and filled dots indicates the LLR exceeds the critical value. CI = Confidence Interval, LLR = Log Likelihood Ratio, TaR = Time-at-Risk.

