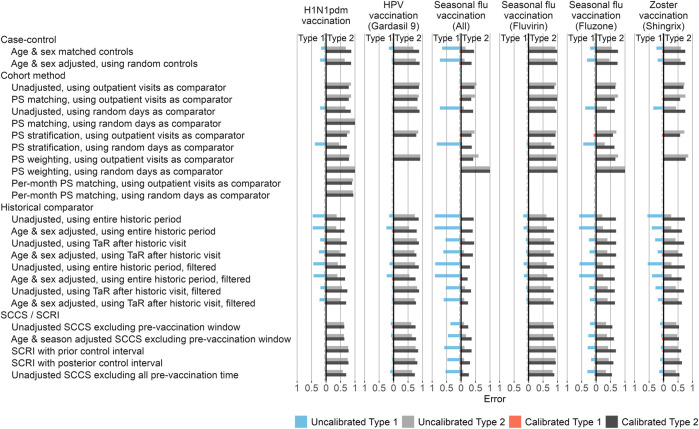
FIGURE 4.
Type 1 and 2 error before and after empirical calibration. For each method variation and vaccine group, the type 1 and 2 error before and after empirical calibration in the Optum EHR database are shown. The x-axis indicates the type 1 error (higher values to the left) and type 2 error (higher values to the right), based on the (calibrated) one-sided p-value. The dashed line indicates nominal type 1 error of 5%. HPV = Human papillomavirus, PS = Propensity Score, SCCS = Self-Controlled Case Series, SCRI = Self-Controlled Risk Interval, TaR = Time-at-Risk.

