Figure 1.
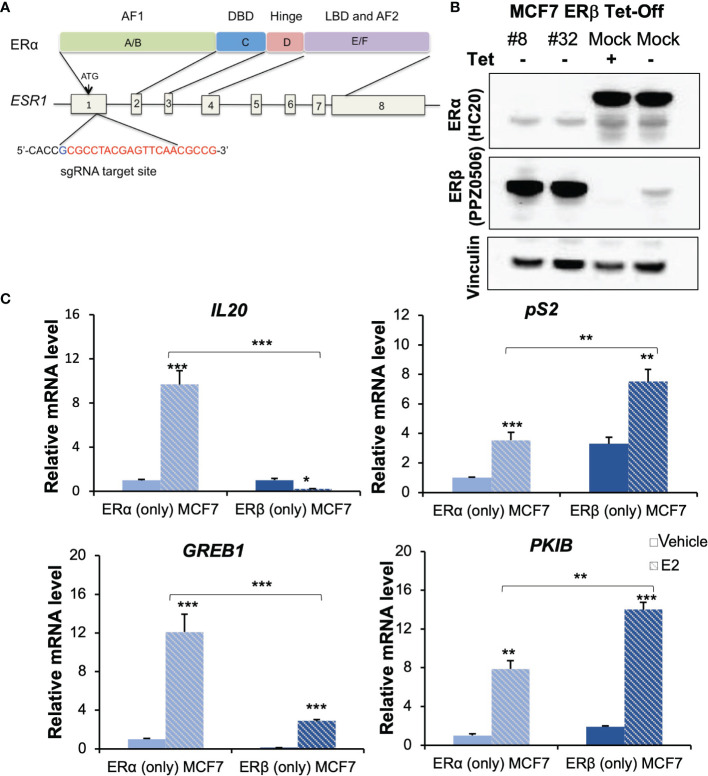
Generation and characterization of ERβ (only) MCF-7 cells. (A) Domain structure of ERα (upper) and genomic structure of ESR1 gene (bottom). The sgRNA target site is located at 5’-end of exon 1 and the 20-nt guide sequence is indicated in red letters. (B) ER expression was validated for the indicated receptors by Western blot analysis, using vinculin as loading control. Lane 1-2: ERβ (only) #8 and #32 clones, lane 3: ERα (only) cells (mock, in presence of Tet) and lane 4: showing induction of ERβ (mock, 20h after removal of Tet). (C) mRNA levels of IL20, pS2, GREB1 and PKIB were measured by qPCR in ERα (only) and ERβ (only, #32) following treatment with vehicle or E2. Data is represented as means + SD (n=3) and analyzed using two-way ANOVA followed by Bonferroni test, *P < 0.05, **P < 0.01, ***P < 0.001.

