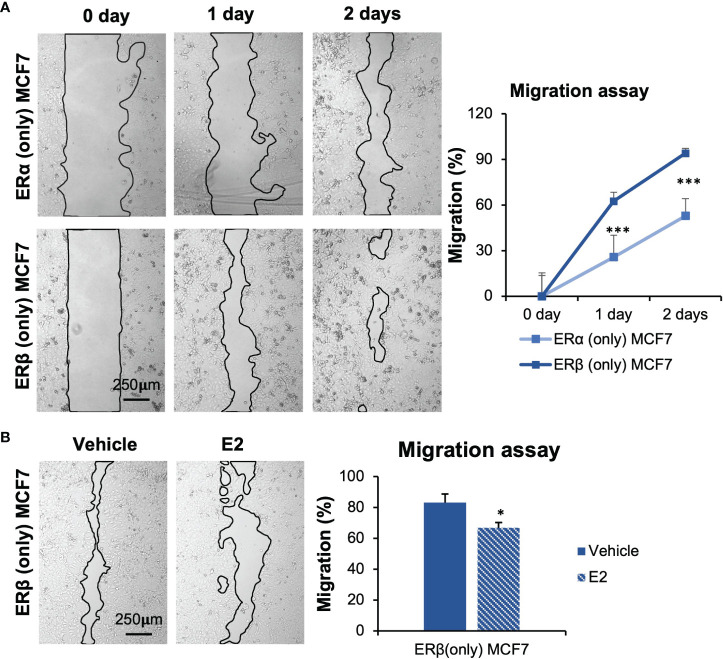
Figure 3.
ERα and ERβ impact cell migration differently. (A) Wound healing assay was performed using inserts (µ-Dish). Cells were cultured in full-serum medium, and pictures were taken at day 0, 1, and 2 after inserts were removed. Area after migration was measured with ImageJ. The initial area at day 0 for each cell line was used for normalization. (B) Impact of E2 treatment in ERβ-expressing MCF7 cells was measured. Cells were seeded in presence of inserts, starved for 72 h, inserts were removed, and cells were treated with E2 or vehicle. Pictures were taken after 2 days. Data is presented as means ± SD (n=6-8). A was analyzed by two-way ANOVA followed by Bonferroni test, B was analyzed by Student’s t-test. *P < 0.05, ***P < 0.001.

