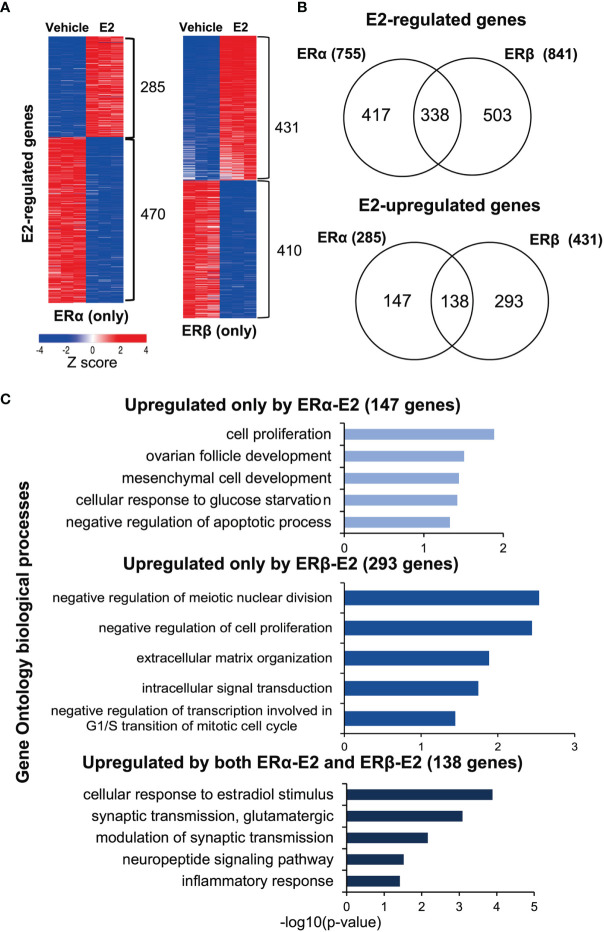
Figure 4.
ERα and ERβ regulate the transcriptome differently. (A) Heatmap illustrating E2-regulated gene expression profiles by ERα (left) and ERβ (right), as determined by RNA-seq. Red indicates higher expression, blue lower. The heatmap was generated using the web-based tool Morpheus (https://software.broadinstitute.org/morpheus/) and the gene expression data (log2fold change) were normalized by Z-score. (B) Overlap of all E2-regulated genes (top), and E2-upregulated genes specifically (bottom) by ERα or ERβ. (C) Enrichment analysis of biological functions related to the E2-upregulated genes (corresponding to the groups in B, lower panel) for ERα (147 genes, top), ERβ (293 genes, middle), and by both receptors (138 genes, lower graph) using DAVID.

