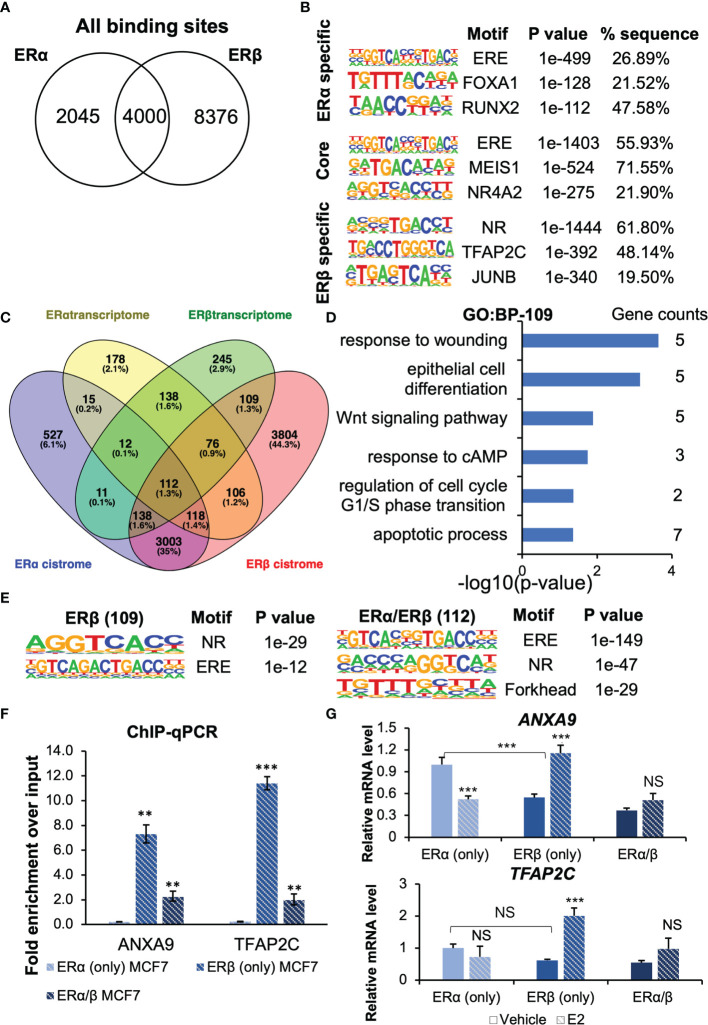
Figure 5.
The ERs cistrome and transcriptome. (A) Venn diagram comparing ERα and ERβ binding sites. (B) Top-3 enriched motifs in ERα-specific, common core, and ERβ-specific cistrome. (C) Venn diagrams of ERα and ERβ transcriptome and cistrome data from MCF7 cells identify 109 genes regulated uniquely by ERβ through both chromatin-binding and transcriptional regulation, but only 30 genes that are unique for ERα. (D) Enrichment analysis of biological functions for the 109 uniquely ERβ-regulated genes. (E) Top-3 enriched motifs among ERβ-specifically regulated genes, and those regulated by both ERs. (F, G) Confirmation of ER binding and regulation of ANXA9 and TFAP2C with ChIP-qPCR and qPCR. Data is shown as means ± SD (n=3), and analyzed by two-way ANOVA followed by Bonferroni test. P < 0.05, **P < 0.01, ***P < 0.001, NS, Not significant.

