Figure 2.

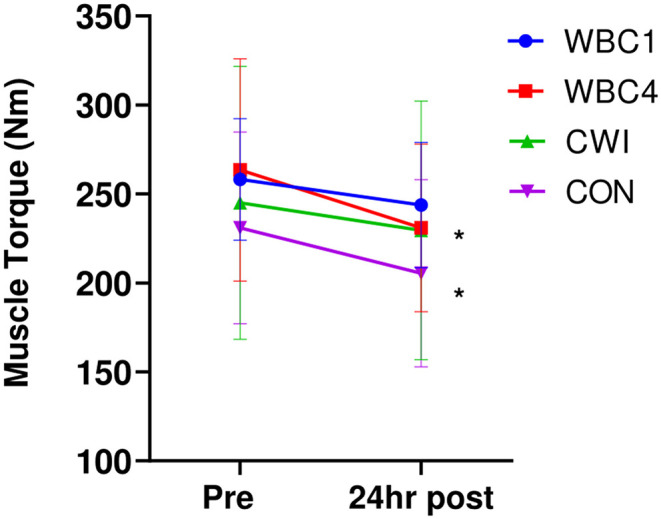
Maximal muscle torques for WBC1, WBC4, CWI and CON groups. *p < 0.05 for decrease in WBC4 and CON only. Data presented as means ± standard deviations. N = 33.

Maximal muscle torques for WBC1, WBC4, CWI and CON groups. *p < 0.05 for decrease in WBC4 and CON only. Data presented as means ± standard deviations. N = 33.