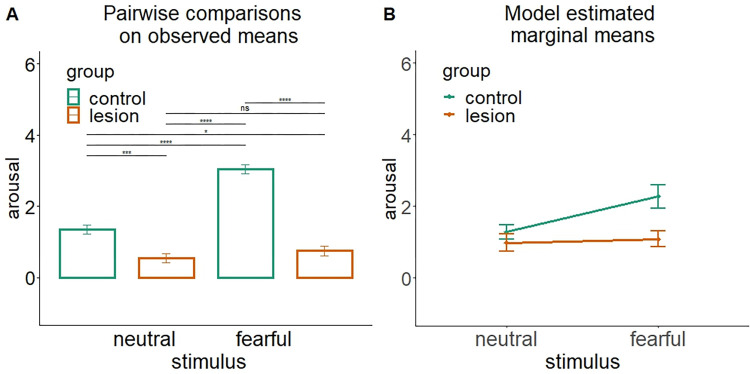
Fig 4. Two ways to represent and interpret an interaction effect arising from a three-way Anova having as independent variables: Group (lesion/control), stimulus (fearful/neutral) and working memory ability.
The plot represents the statistically significant group by stimulus interaction. The working memory did not significantly interact with any variable. (A) Barplot with observed means (± standard error) as classically used to represent post-hoc pairwise comparisons between all sublevels involved in an interaction effect (**** = p<0.001, ns = p>0.05). (B) Model estimated marginal means and 95% confidence intervals.

