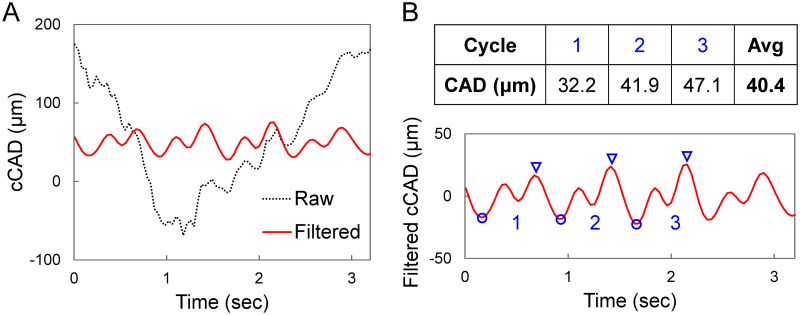
Fig 2.
A. Raw and band-pass filtered cCAD curves from one OPE measurement in a KC patient showing eye motion in raw cCAD which was effectively removed by filtering. B. CAD for each measurement was calculated as the average trough (blue circle) to peak (blue triangles) distance for three automatically selected cycles.

