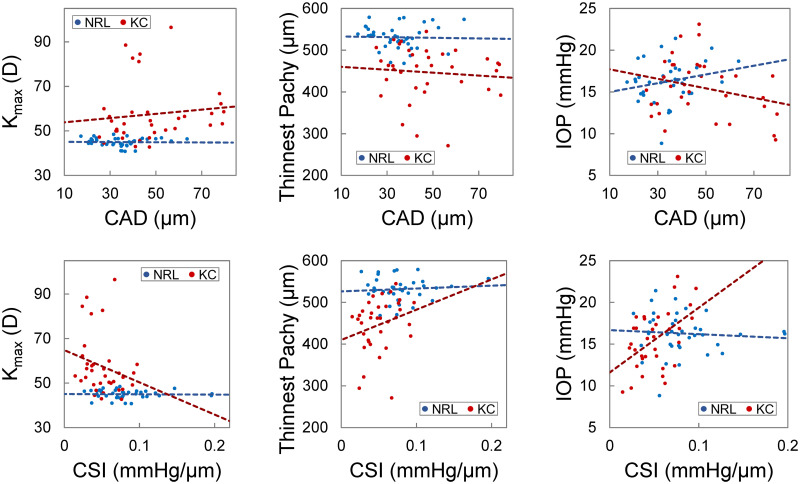
Fig 7. Scatter plots of CAD (top), CSI (bottom) vs. Kmax, thinnest pachymetry, and IOP.
These plots indicated potential trends of correlation between CSI and Kmax or thinnest pachymetry and a significant correlation between CSI and IOP (p = 0.003) in KC eyes (red dots) but not in normal controls (blue dots). CAD was not correlated with Kmax, thinnest pachymetry, or IOP in either group.

