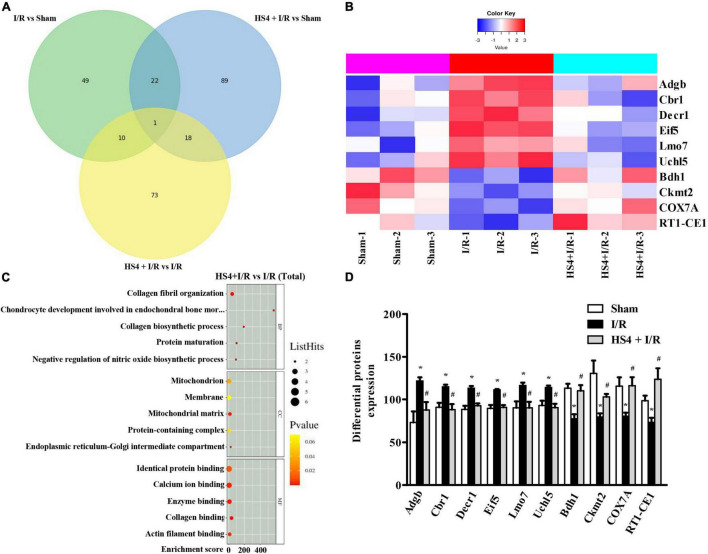
FIGURE 6.
Quantitative proteomics analysis of HS4 + I/R group compared with I/R. (A) The Venn diagram of differentially expressed proteins (DEPs) among the three groups of Sham, I/R, and HS4 + I/R. (B) The bubble diagram of the top 15 enriched GO terms identified between HS4 + I/R group and I/R group using BP, CC, and MF. (C,D) The heat map and quantitative statistics of DEPs in Sham group, I/R group, and HS4 + I/R group.

