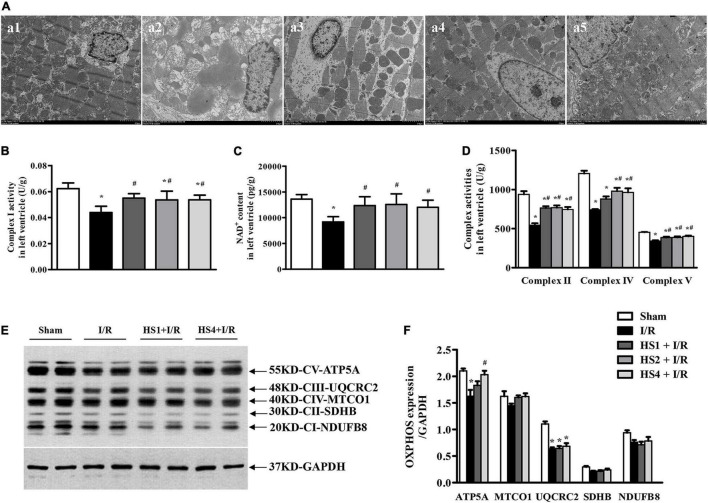
FIGURE 7.
Effect of Herba Siegesbeckiae (HS) on myocardial ultrastructure and mitochondrial ETC function. (A) Representative images of myocardial ultrastructure acquired at × 2.5 K magnification in Sham (a1), I/R (a2), HS1 + I/R (a3), HS2 + I/R (a4), and HS4 + I/R (a5) groups. (B,C) The Complex I activity (B) and NAD+ content (C) in left ventricle in various groups (n = 6). (D) The activities of Complexes II, IV, and V in the left ventricle in various groups (n = 6). (E) The representative image of OXPHOS expression. (F) The quantitative analysis of OXPHOS expression (n = 4). *P < 0.05 vs. Sham group, #P < 0.05 vs. I/R group.

