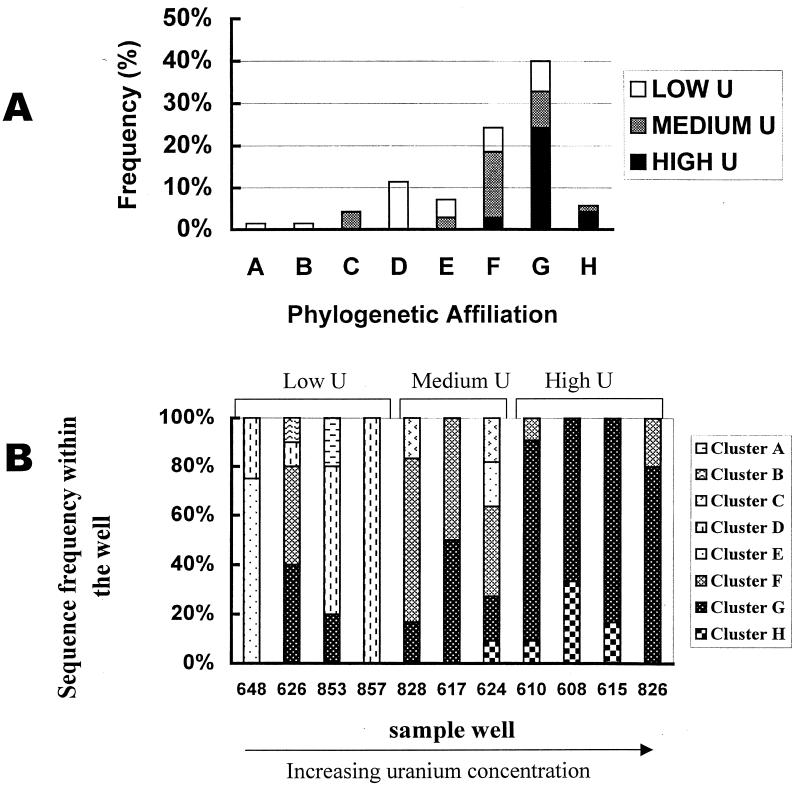
FIG. 6.
(A) Sequence distribution for 70 DSR clone sequences (α-subunit) obtained from high-uranium [samples 610, 608, 615, and 826; U(VI) from 2,847.5 to 1,687 ppb], medium-uranium (samples 624, 617, and 828; U(VI) from 1,205 to 342.7 ppb), and low-uranium samples (857, 853, 626, and 648; U(VI) from 301 to 0.001 ppb). (B) SRB population structure in different sample wells as measured by DSR sequences recovered and their affiliation with different cluster of SRB.

