FIGURE 1.

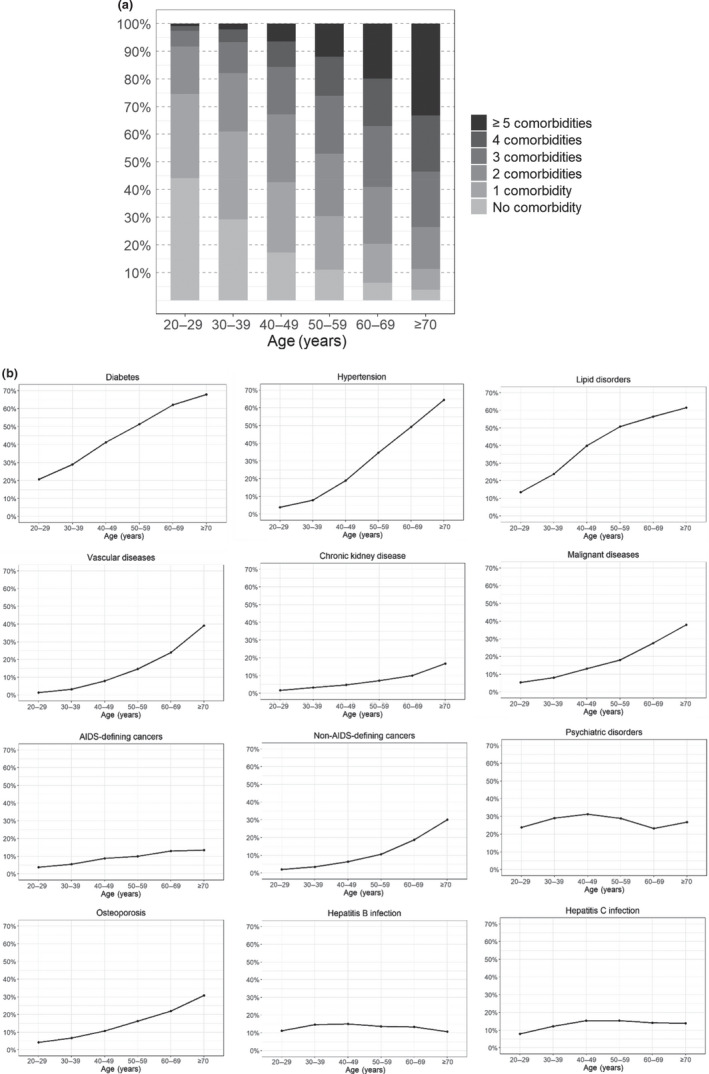
(a) Number of chronic comorbidities or infections by age group. (b) Types of chronic comorbidities or infections by age group

(a) Number of chronic comorbidities or infections by age group. (b) Types of chronic comorbidities or infections by age group