
FIGURE 3.
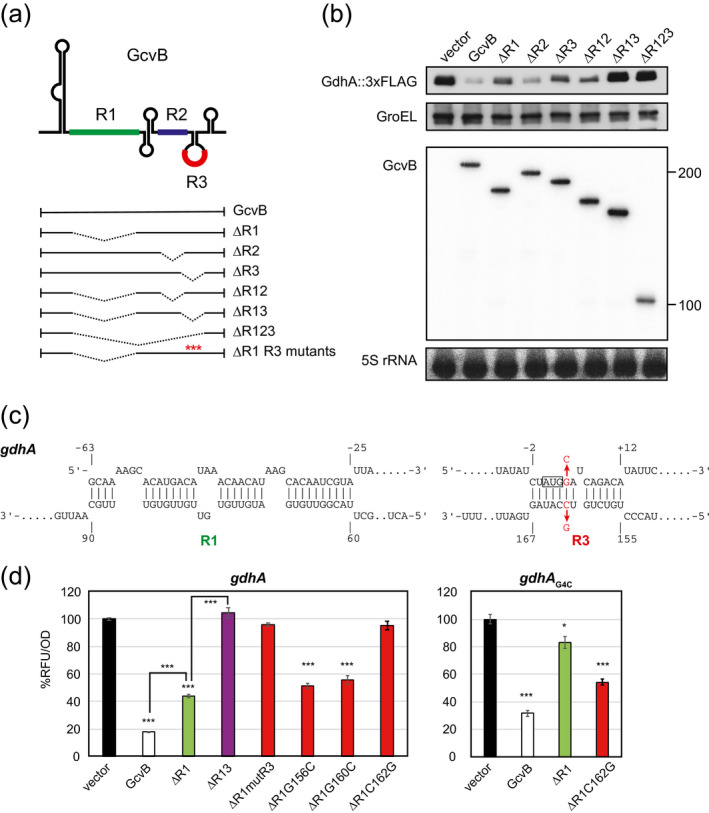
GcvB regulates gdhA mRNA through both R1 and R3 seed regions. (a) Schematic of GcvB and its deletion mutants. The transcribed regions are shown in plain line, and deleted regions are represented by dashed lines. Mutations in the R3 region (G156C, G160C, C162G, and mutR3) are indicated by red asterisks. (b) Western and northern blot analyses of chromosomally expressed GdhA::3xFLAG in Escherichia coli ΔgcvBΔsroC strain harboring pTP11 (vector), the GcvB‐expressing plasmid (GcvB), or its derivatives. The samples were collected at an OD600 of 1.0. (c) Base‐pairing interactions between GcvB and gdhA mRNA predicted by the IntaRNA program. (d) GFP reporter assays of gdhA::sfGFP in E. coli ΔgcvBΔsroC strain harboring pTP11 (vector), pPL‐gcvB (GcvB), or its derivatives. Mean fluorescence of biological replicates (n > 3) with SD are presented in percentage relative to the vector control. Statistical significance was calculated using one‐way ANOVA comparing GcvB or GcvBΔR1 with the vector control and denoted as follows: ***p < .001, *p < .05