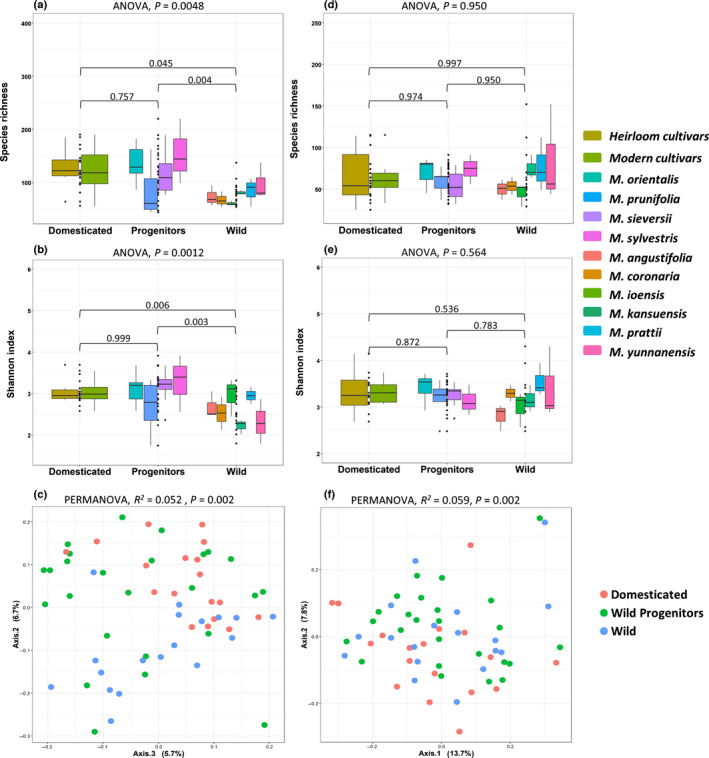
Fig. 2.

Box plots showing fungal (a–c) and bacterial (d–f) richness, Shannon diversity and community composition. The presented species were grouped into three groups from left to right: heirloom and modern cultivars of domesticated apple (Malus × domestica), wild progenitors (M. orientalis, M. prunifolia, M. sieversii, and M. sylvestris), and nonprogenitor Malus species (M. angustifolia, M. coronaria, M. ioensis, M. kansuensis, M. prattii, and M. yunnanensis). Superimposed on the box plots are the horizontally jittered raw data points combined for each domestication group. Box plots show the median (horizontal line), the lower and upper bounds of each box plot denote the first and third quartiles, and whiskers above and below the box plot show 1.5 times the interquartile range. The points located outside of the whiskers of the box plot represent the outliers. Ordination plots of fungal (c) and bacterial (f) community composition of Malus × domestica, wild progenitors and wild Malus species, based Bray–Curtis dissimilarity index. Results of the global statistical analyses are reported at the top of each panel and pairwise comparisons for alpha diversity are added onto the box plots.
