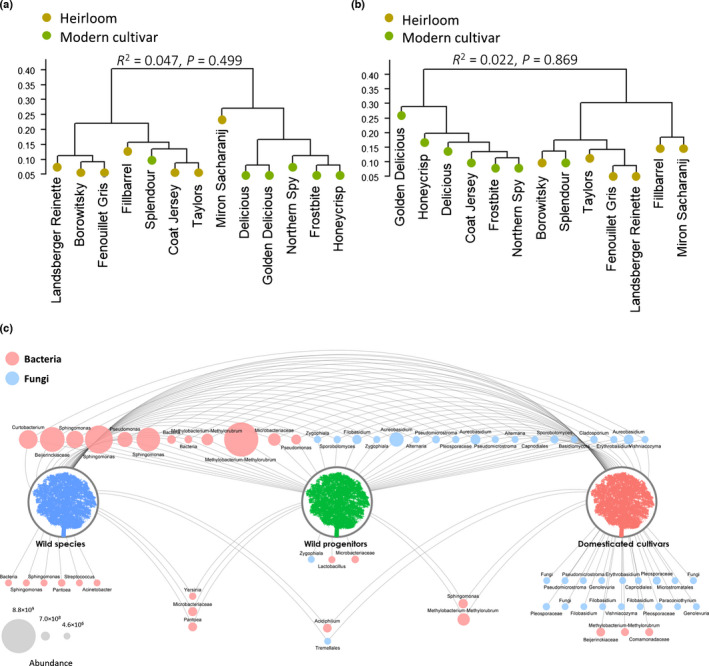
Fig. 3.

Dendrogram based on the similarity of the core fungal (a) and bacterial (b) community composition, according to Bray–Curtis index among Malus domestica cultivars, highlighting the difference between heirloom and modern cultivars. The dendrograms were visualized using the fviz_dend function in the R package factoextra v.1.0.7. Results of the global statistical analyses are reported at the top of each panel. (c) Network analysis showing the core microbiome distribution from wild Malus species, to progenitors, to domesticated apple. Blue and red circles (nodes) represent fungal and bacterial taxa, respectively. The core microbiome was calculated for each Malus group separately as amplicon sequence variants present in at least 70% of the samples. Node size corresponds to bacterial and fungal abundance, i.e. gene copy numbers measured by qPCR, as indicated in the legend on the lower left.
