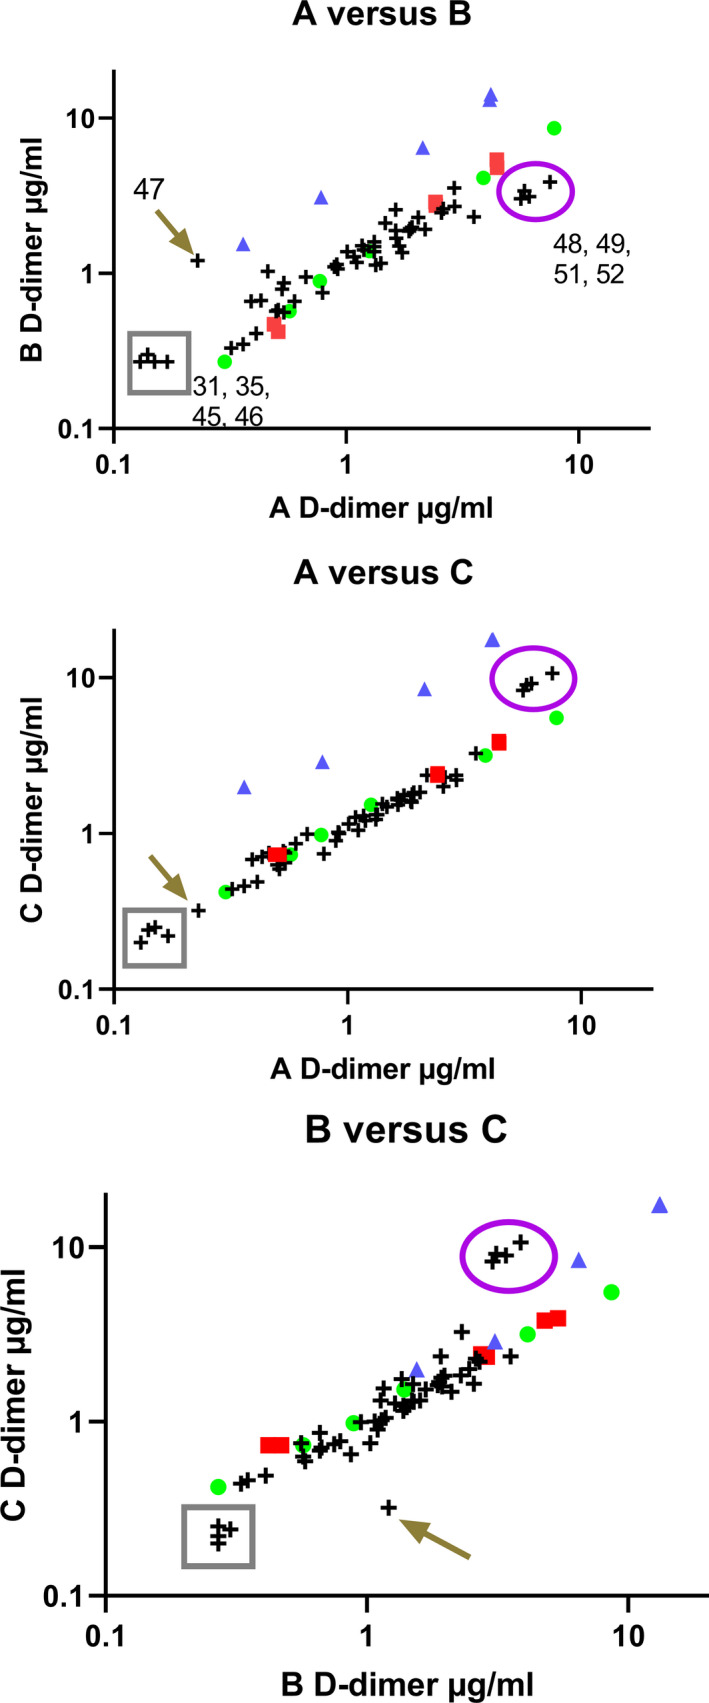
FIGURE 5.

Correlation of results between methods A, B, and C as pairwise comparisons. Samples shown are an internal standard (green circle), and freeze‐dried candidate standards SS258 (red square) and SS523 (blue triangle) with 54 plasma samples (crosses) containing various levels of D‐dimer. Two groups of inconsistent samples are highlighted in the box (plasmas 31, 35, 45, 46) and in the oval (48, 49, 52, 53), along with sample 47 highlighted with the arrow. Log scales are used for presentation purposes
