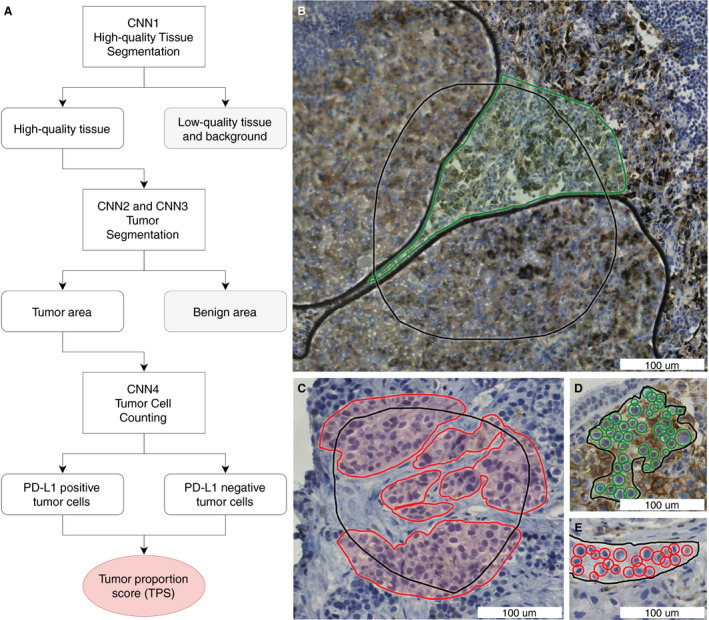
Figure 2.

Algorithm setup and annotations. A, Schematic algorithm setup with four convolutional neural networks (CNNs) to calculate the programmed death‐ligand 1 (PD‐L1) tumour proportion score (TPS). B, Annotations for high‐quality tissue segmentation (CNN1). Green annotated: high‐quality tissue that is in focus and does not contain artefacts. Black: annotated region of interest (ROI), and non‐annotated area within the ROI: the tissue is of low quality in this example, because of air bubbles. C, Annotations for tumour segmentation (CNN2 and CNN3). Red annotated: tumour. Black: annotated ROI, and non‐annotated area within the ROI: non‐neoplastic tissue. D,E, Annotations for tumour cell counting (CNN4). Green: annotated PD‐L1‐positive nuclei. Red: annotated PD‐L1‐negative nuclei. Black: annotated ROI. The TPS can be calculated from the number of PD‐L1‐positive tumour cells and the number of PD‐L1‐negative tumour cells (Formula 1 in Data S1). All annotations were placed in the training set (n = 60), which was withheld from validation.
