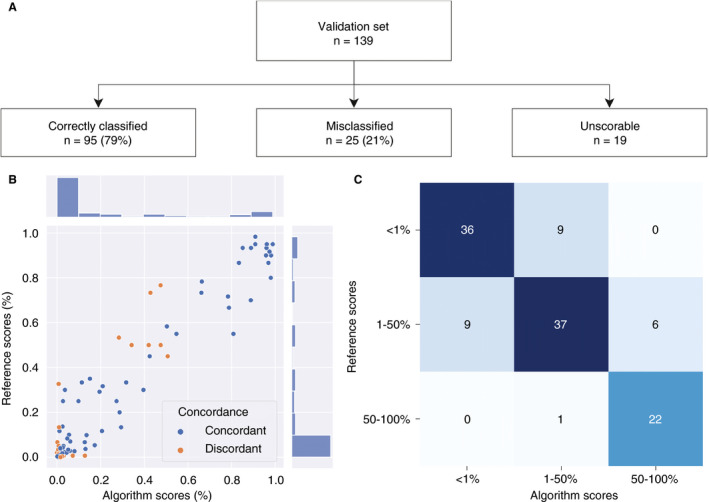
Figure 5.

Algorithm validation set results. A, Flowchart for the validation process. B, Scatterplot for the mean of the three pathologists’ continuous tumour proportion scores (TPSs): the reference score (Formula 2 in Data S1) is on the y‐axis, and the continuous algorithm score is on the x‐axis. C, Confusion matrix for categorical TPSs (<1%, 1–49%, and 50–100%): the reference score categories are on the y‐axis, and the algorithm score categories are on the x‐axis. [Colour figure can be viewed at wileyonlinelibrary.com]
