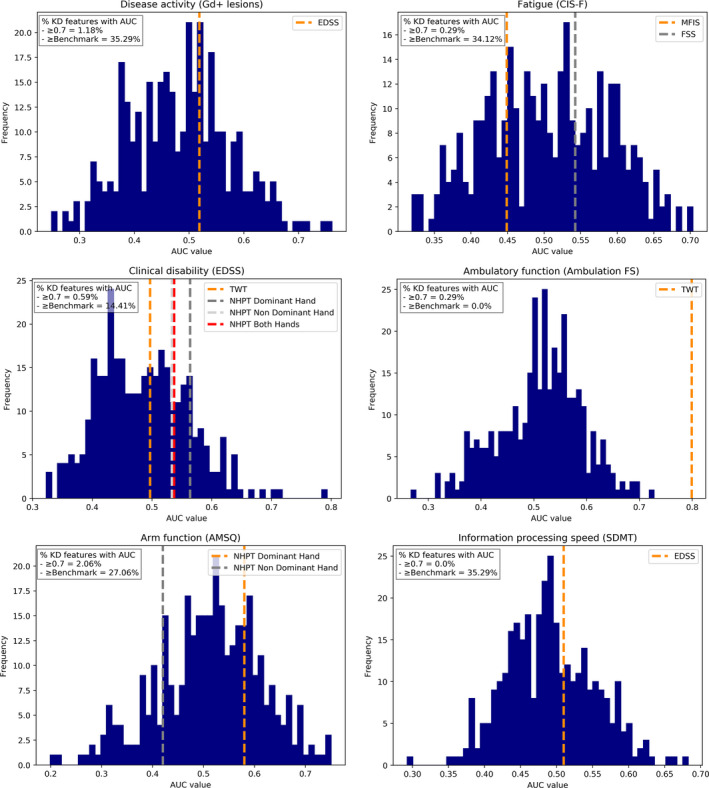
FIGURE 2.

Histograms of area under the curve (AUC)‐values for all keystroke features for each study outcome. AUC‐values of comparative clinical benchmarks are shown as dotted lines. Ambulation FS, EDSS Ambulation Functional System; AMSQ, Arm function in MS Questionnaire; AUC, area under the curve; CIS‐F, Checklist Individual Strength Fatigue subscale; EDSS, Expanded Disability Status Scale; FSS, Fatigue Severity Scale; Gd+ lesions, gadolinium‐enhancing lesions; KD, keystroke dynamics; MFIS, Modified Fatigue Impact Scale; NHPT, Nine‐Hole Peg Test; SDMT, Symbol Digit Modalities Test; TWT, Timed 25‐foot Walk Test [Color figure can be viewed at wileyonlinelibrary.com]
