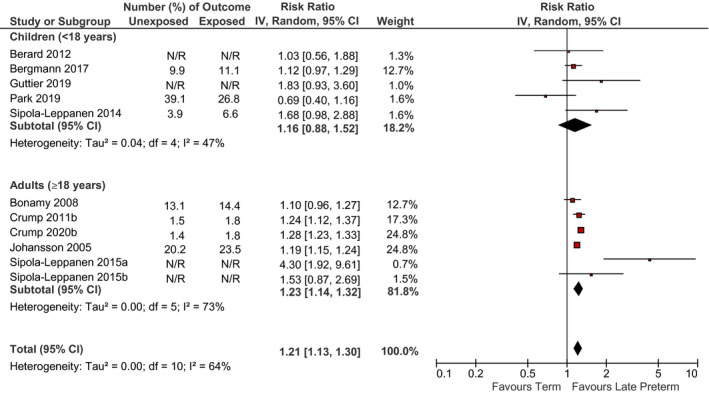
FIGURE 4.

Relation between late preterm birth and incidence of hypertension (late preterm birth vs. term birth) in children <18 years and adults ≥18 years. Pooled risk estimate is represented by the black diamond. Values of I 2 > 50% indicate substantial heterogeneity. Values >1 indicate an adverse association in those born late preterm. CI, confidence interval; RR, risk ratio
