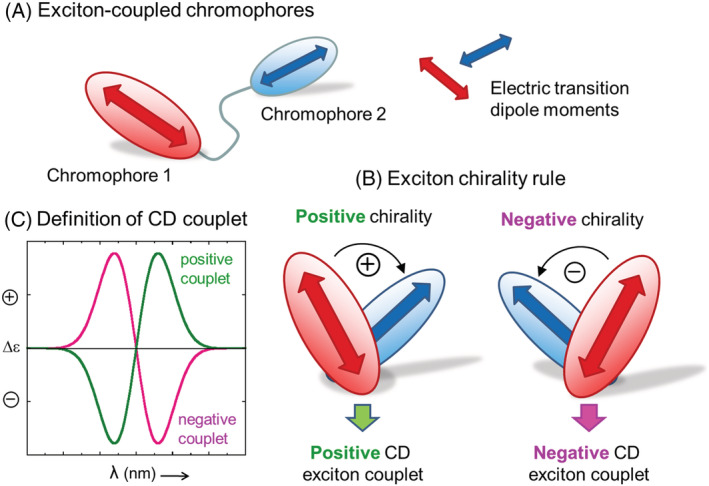
FIGURE 1.

(A) Schematic representation of two exciton‐coupled chromophores undergoing electric dipole allowed transitions and their transition dipole moments (TDMs). (B) Definition of CD exciton couplet and its sign. (C) Formulation of the exciton chirality rule
