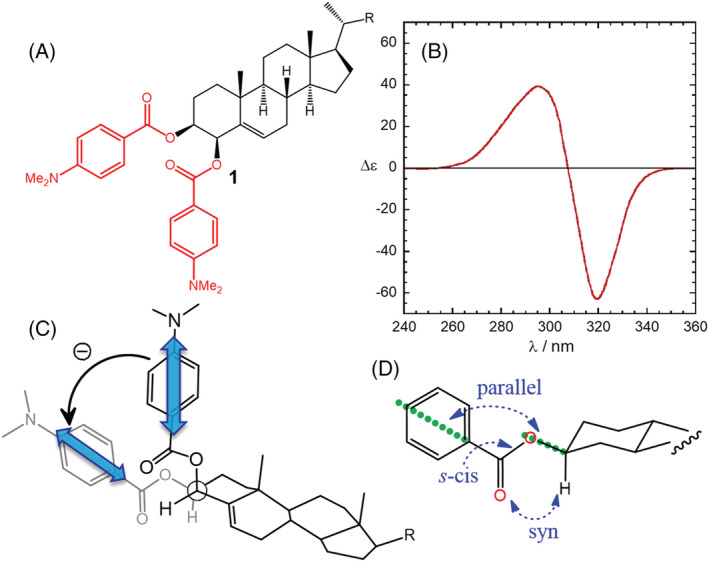
FIGURE 2.

Application of the ECM to cholest‐5‐ene‐3β,4β‐diol bis(p‐dimethylaminobenzoate) (1). (A,B) Diagram and ECD spectrum (ethanol) showing a negative exciton couplet. Adapted with permission from ref. 57 Copyright 1974 American Chemical Society. (C) Negative helicity defined by the two transition dipoles. (D) Preferential conformation around each ester bond
