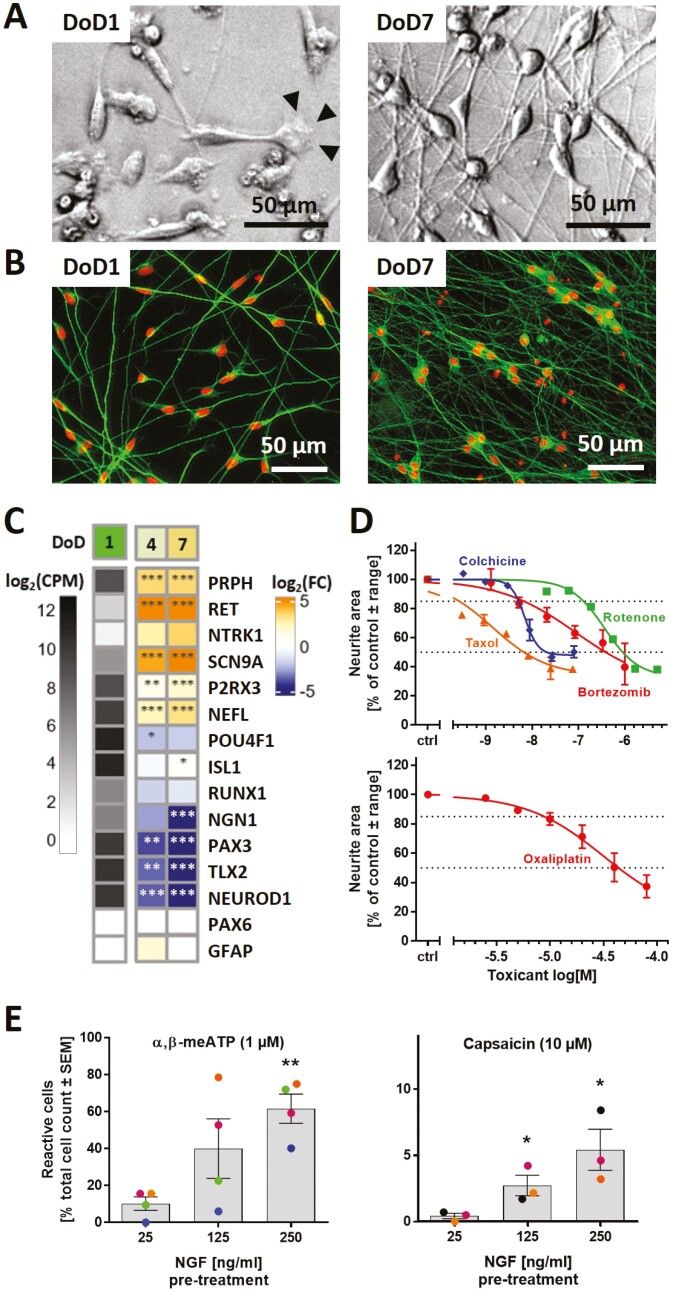
Figure 1.
Human sensory neurons derived from iPSCs. Cells were pre-differentiated for 9 days and frozen (Supplementary Fig. S1A). Counting of peripheral neuronal age in days of differentiation (DoD) started after thawing and plating (DoD0). (A) Phase-contrast images of DoD1/DoD7 neurons. Arrowheads indicate a growth cone. (B) DoD1/DoD7 cultures stained for the neuronal cytoskeletal marker β-III-tubulin (green); DNA is shown in red. (C) Gene expression levels were determined by the TempO-Seq method. The left column shows the absolute expression levels of selected marker genes on DoD1 in counts of the corresponding gene per 1 million reads (CPM). The data for DoD4/DoD7 show the fold change (FC) of the expression levels vs DoD1. The color scale uses log2FC units (see Supplementary Material for complete data sets). (D) Neurons were used in the PeriTox test to assess the effects of toxicant exposure (24 h) on neurites. Data are given as mean ± range of 2-3 biological replicates. Viability was not significantly affected at the tested drug test concentrations (see Supplementary Fig. S1B). (E) Mature neurons (DoD25-45) were used for Ca2+-imaging. Cells reacting to the application of α,β-methylene ATP (α,β-meATP) and capsaicin were quantified. The effect of pre-treatment (48 h) with increased concentrations of nerve growth factor (NGF) on the percentage of reactive cells was assessed. Data displayed as bars are means ± SEM of 3-4 biological replicates. Color matching data points are derived from the same experiment. *P < .05, **P < .005, when tested vs control conditions (25 ng/mL NGF).

