Figure 4.
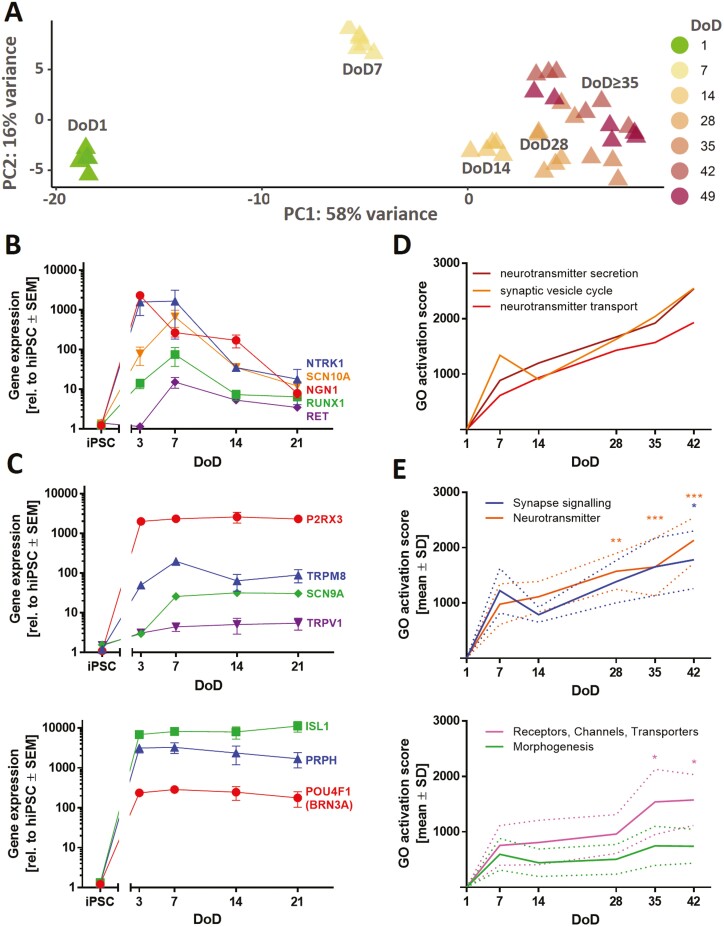
Time-dependent transcriptome profiling of iPSC-derived sensory neurons. (A) TempO-Seq whole transcriptome analysis (19 000 genes). For the top 500 variable genes of this data set (full data in Supplementary Material) a PCA was performed. In the 2-dimensional PCA display, seven maturation stages of PNN are color-coded according to their DoD. Data points are derived from 3 independent differentiations. (B,C) Gene expression levels of sensory neuron and nociceptor marker genes were assessed via RT-qPCR. Data are means ± SEM, n = 3-4. Error bars smaller than the data point symbols are not shown. (D) Over-represented gene ontology (oGO) terms were determined for the significant DEGs on DoD42. Quantitative activation scores of the Top50 oGOs were calculated for all time points by “multiplying the percentage of genes within the GO that was found to be significantly regulated with the average fold change of these regulations”.51 Activation scores for the GO terms “neurotransmitter secretion,” “synaptic vesicle cycle,” and “neurotransmitter transport” are shown over time. (E) oGO terms were assigned to the superordinate groups “Synapse signaling,” “Neurotransmitter,” “Receptors, Channels, Transporters,” and “Morphogenesis” (see Supplementary Fig. S7). Means of the activation scores of all oGOs belonging to one group are shown to visualize the development of these biological categories over time. The dotted lines indicate the upper and lower bounds of the SEM. Significance was tested against the respective mean activation scores on DoD7. *P < .05, **P < .001, ***P < .0001.

