Figure 5.
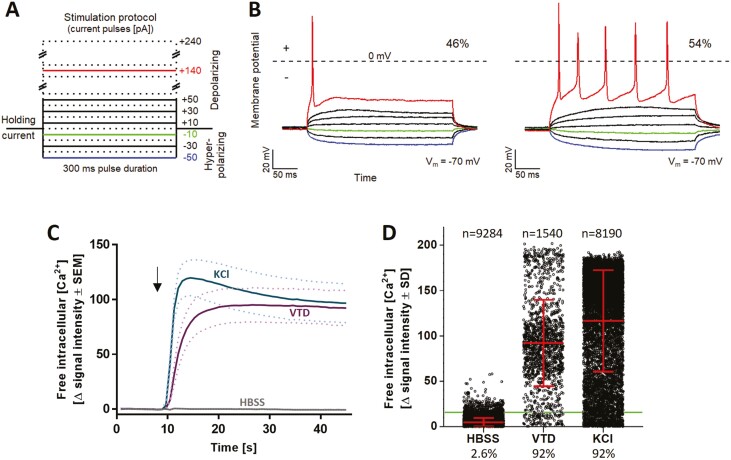
Characterization of neuronal excitability of PNN. PNN (DoD28-35) were used for current-clamp recordings and Ca2+-imaging experiments. (A) Schematic representation of the stimulation protocol used for current-clamp recordings. Current pulses were applied with a pulse duration of 300 ms and a pulse frequency of 0.2 Hz, starting at −50 pA and increasing in steps of +10 pA. Example pulses are colored. (B) Current-clamp measurements of PNN (n = 28). Cells exhibit phasic (46%) (B, left) or tonic (54%) (B, right) action potential firing behavior. (C) Representative traces of changes in Ca2+ indicator fluorescence (=Δ signal intensity) in response to the negative control HBSS (Hanks’ balanced salt solution), the positive control KCl [50 mM], and the voltage-gated sodium (NaV) channel opener veratridine (VTD) [3 µM]. The arrow indicates the time point of stimulus addition. Data are shown as means of 4 biological replicates. The dotted lines indicate the upper and lower bounds of the SEM. (D) Quantification of the percentage of reactive cells according to their Δ signal intensity values upon HBSS, VTD, or KCl addition. The horizontal line indicates the noise boundary of the Δ signal intensity. Each dot represents the Δ signal intensity of an individual cell. The mean ± SD of all cells is shown. The percentage of reactive cells is indicated below the diagram and the exact number of measured cells is given above. A total of more than 10 000 cells was individually measured in 14 experiments.

