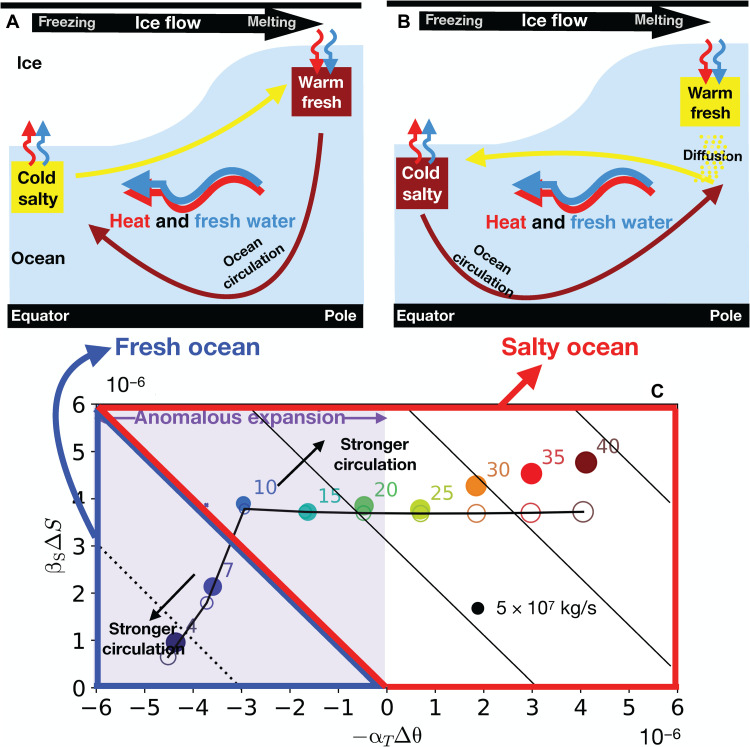
Fig. 2. Different ocean circulations in salty and fresh ocean.
At the top, we show schematics of ocean circulation and associated transports of heat (red wiggly arrows) and fresh water (blue wiggly arrows) for (A) a fresh ocean (αT < 0) and (B) a salty ocean (αT > 0). Dark brown (yellow) arrows denote sinking (rising) of dense (buoyant) water. (C) Regime diagram demonstrating the influence of temperature and salinity anomalies on the equator-to-pole density difference assuming different salinities (marked on the shoulder of each circle), and how the ocean’s overturning circulation responds in general circulation model (GCM) simulations (filled circles) and our conceptual model (empty circles; see the “Exploring mechanisms with a conceptual model” section). Horizontal and vertical axes are the density difference associated with temperature and salinity anomalies, −αTΔθ and βSΔS. Both ΔS and −Δθ are positive in our setup; they are computed by taking the difference between the maximum and minimum within the northern hemisphere. The sign of the coordinates reflects the sign of αT and βS. In the high/low S0 experiments, the signs of −αTΔθ and βSΔS are the same/opposite. The size of each circle represents the amplitude of the overturning circulation (the peak Ψ occurs in the northern hemisphere). The 45° tilted black lines are isolines of the equator-to-pole density difference Δρ. Solid (dotted) lines denote dense water near the equator (poles).

