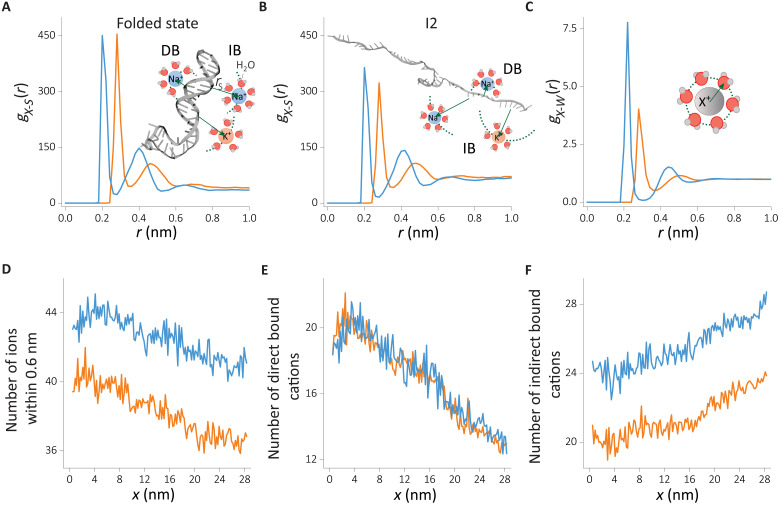
Fig. 4. Cation distributions around the HIV-1 TAR hairpin in the folded and unfolded states.
RDFs are computed from the surface of the RNA to the cation. (A and B) RDF of cation-RNA, gX − S(r), (A) in the folded state and (B) in the unfolded intermediate state I2. Schematics in (A) and (B) illustrate the two binding modes: direct binding (DB) and indirect binding (IB). (C) RDF of cations (X+) with the oxygen atom of water, gX − W(r). (D to F) Changes in the number of Na+ and K+ coordination computed from cumulative distribution (see Methods for details), (D) the total number of ions within 0.6-nm influence radius from the RNA surface, (E) the directly bound cations, and (F) the number of indirectly binding cations. Data for Na+ and K+ are given in blue and orange, respectively

