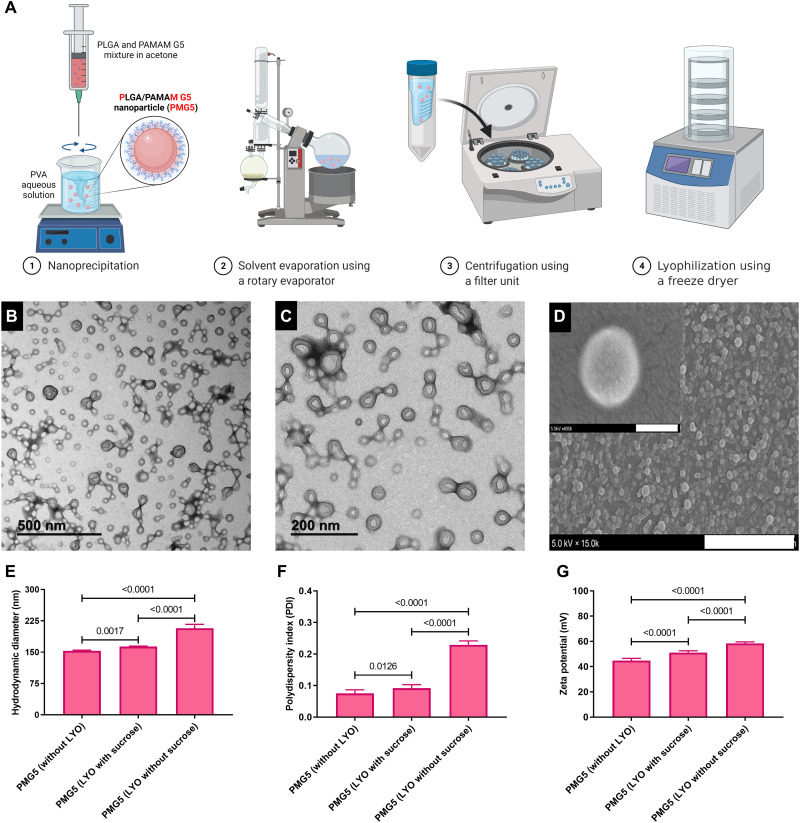
Fig. 1. Preparation and characterization of PMG5.
(A) Diagram summarizing the major stages involved in the synthesis of PMG5. (B and C) TEM images of PMG5 at different magnifications (negative stain, 1.5% phosphotungstic acid). (D) Scanning electron photomicrograph of PMG5. Scale bars, 3 μm and (inset) 100 nm. (E) Graph showing the hydrodynamic diameter of the indicated groups. (F) Graph showing the size distribution (PDI) of various groups. (G) Graph showing the net surface charge (zeta potential) of the indicated groups. Data are plotted as means ± SD. Error bars represent SD, n = 9. LYO, lyophilization.

