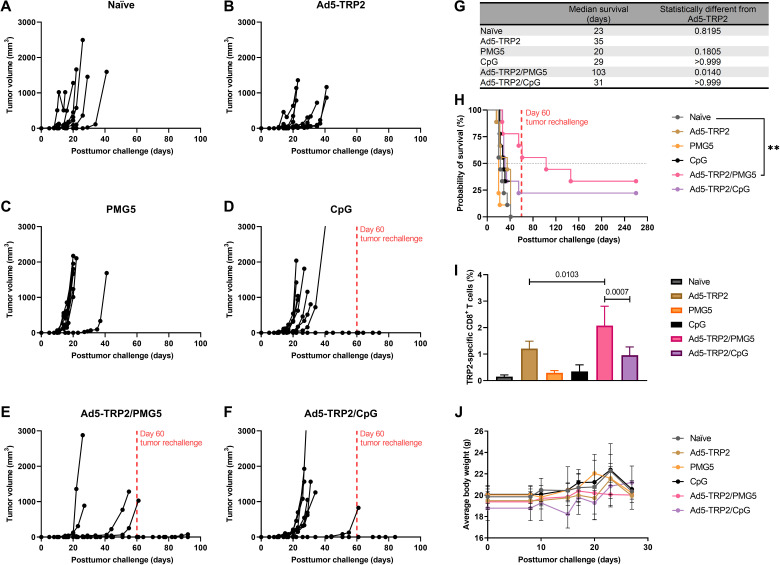
Fig. 4. Therapeutic immunizations of C57BL/6J mice with Ad5-TRP2 and peritumoral administrations of PMG5.
(A to F) Tumor volume curves of mice treated with the designated treatment. (G) Table showing the median survival of mice. (H) Survival curve of mice treated with different treatments after being challenged with tumors. **P < 0.01. (I) Graph showing the percent of TRP2-specific CD8+ T cells in the peripheral blood (14 days after tumor challenge). (J) Graph showing the average weight of mice over time. Data are plotted as means ± SD. For (H), the probability was determined by the log-rank test with all groups compared to the naïve group, adjusted for multiple comparisons. For (I), the probability was determined by one-way ANOVA with Tukey posttest.

