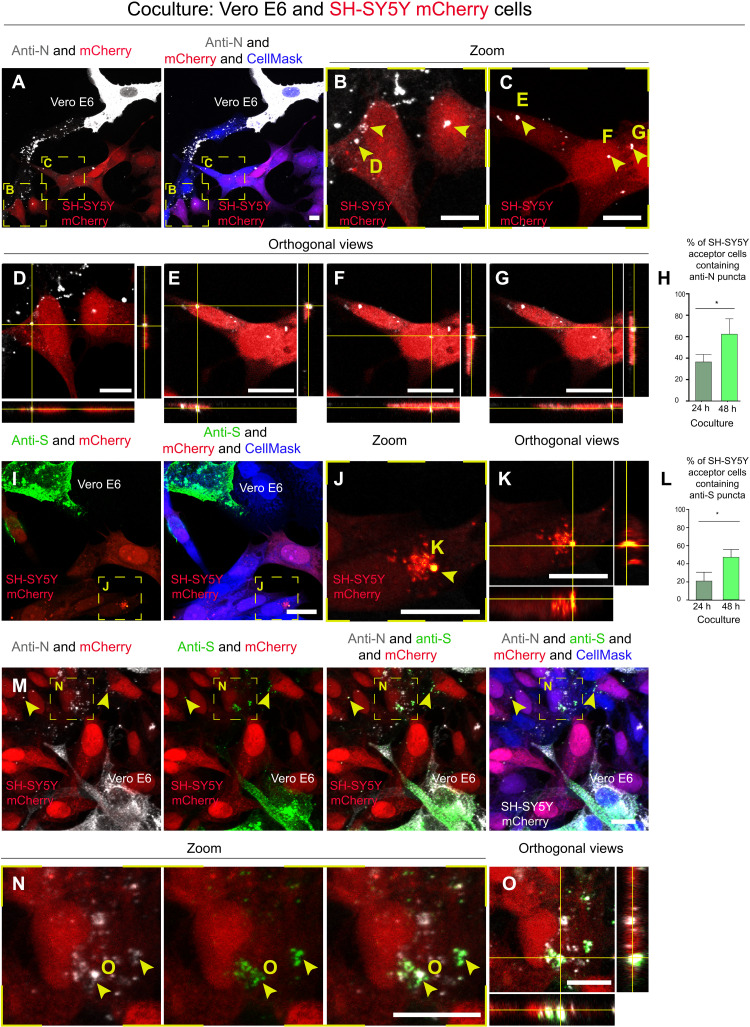
Fig. 1. SARS-CoV-2 can reach SH-SY5Y neuronal cells from Vero E6 permissive cells.
Infected Vero E6 cells (donor cells) were cocultured with SH-SY5Y neuronal cells previously stably transfected with a vector that expresses mCherry (acceptor cells). Coculture was fixed at 24 and 48 hours. (A to G) Confocal micrographs showing 48 hours of coculture between SARS-CoV-2–infected Vero E6 cells and SH-SY5Y mCherry cells. An anti-N antibody was used to detect SARS-CoV-2 nucleoproteins. (B and C) Enlargement of the yellow dashed squares in (A); the yellow arrowheads indicate the anti-N puncta detected in the cytoplasm of acceptor cells. (D to G) The orthogonal views of (B) and (C) showing the anti-N puncta inside the cytoplasm of acceptor cells. (H) Graph showing the mean percentage of anti-N puncta transferred to acceptor cells after 24 and 48 hours of coculture. *P = 0.0468. (I to K) Confocal micrographs showing 48 hours of coculture between SARS-CoV-2–infected Vero E6 cells and SH-SY5Y mCherry cells. An anti-S antibody was used to detect SARS-CoV-2 particles. (J) Enlargement of the yellow dashed square in (I); the yellow arrowhead indicates the anti-S puncta in the acceptor cells. (K) The orthogonal views of (J) showing the anti-S puncta inside acceptor cells. (L) Graph showing the mean percentage of anti-S puncta transferred to acceptor cells after 24 and 48 hours of coculture. *P = 0.0374. (M to O) Double immunostaining of coculture using anti-S and anti-N antibodies. (N) Enlargement of the yellow dashed square in (M) showing colocalization between anti-N and anti-S puncta in SH-SY5Y mCherry acceptor cells. The cytosol has been labeled with CellMask Blue. Scale bars, 10 μm.

