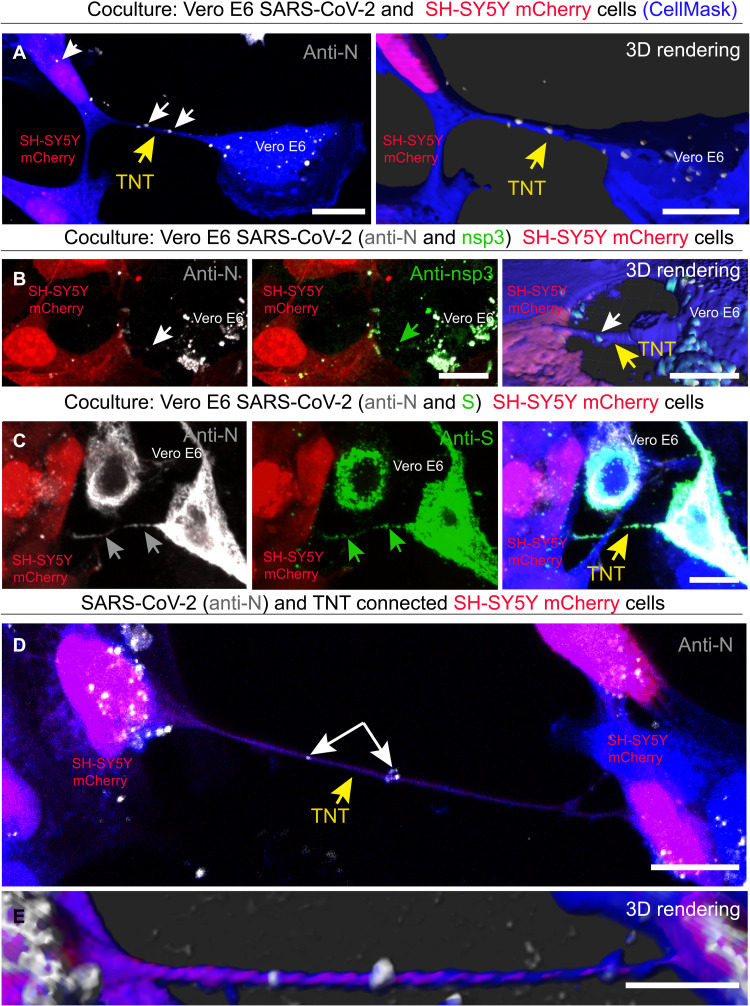
Fig. 3. SARS-CoV-2 spread through TNTs from infected Vero E6 to noninfected SH-SY5Y mCherry cells.
(A) SARS-CoV-2–infected Vero E6 cells were cocultured with SH-SY5Y mCherry cells. Coculture was fixed at 48 hours and stained with the anti-N antibody to detect the virus. Two-dimensional (2D) confocal micrograph (left) and 3D rendering performed by Imaris software (right), showing a TNT connecting SARS-CoV-2–infected Vero E6 cells and SH-SY5Y mCherry cell. The yellow arrows point the TNT between Vero E6 and SH-SY5Y mCherry cells; the white arrows indicate SARS-CoV-2 anti-N signal inside TNT and in the acceptor cells. (B) 2D confocal micrograph and 3D rendering show a TNT connecting infected Vero E6 cells and SH-SY5Y mCherry cells. The TNTs connecting Vero E6 and SH-SY5Y mCherry cells are shown in the 3D rendering. Coculture was stained with the anti-N and anti-nsp3 antibodies. The white arrows indicate the SARS-CoV-2 anti-N signal, and the green arrows indicate the anti-nsp3 signal inside TNT. The yellow arrow points the TNT. (C) Coculture was stained with the anti-N and anti-S antibodies to detect the virus. The gray arrows indicate the SARS-CoV-2 anti-N signal, and the green arrows indicate the anti-S signal inside TNT. The yellow arrow points the TNT. (D and E) 2D confocal micrograph (D) and 3D rendering (E) showing a TNT connecting two SH-SY5Y mCherry cells, cocultured with infected Vero E6 cells. The yellow arrow points the TNT between the SH-SY5Y mCherry cells. The white arrows indicate SARS-CoV-2 inside the TNT. Cellular cytoplasm and TNTs were labeled with CellMask Blue. Scale bars, 10 μm.

