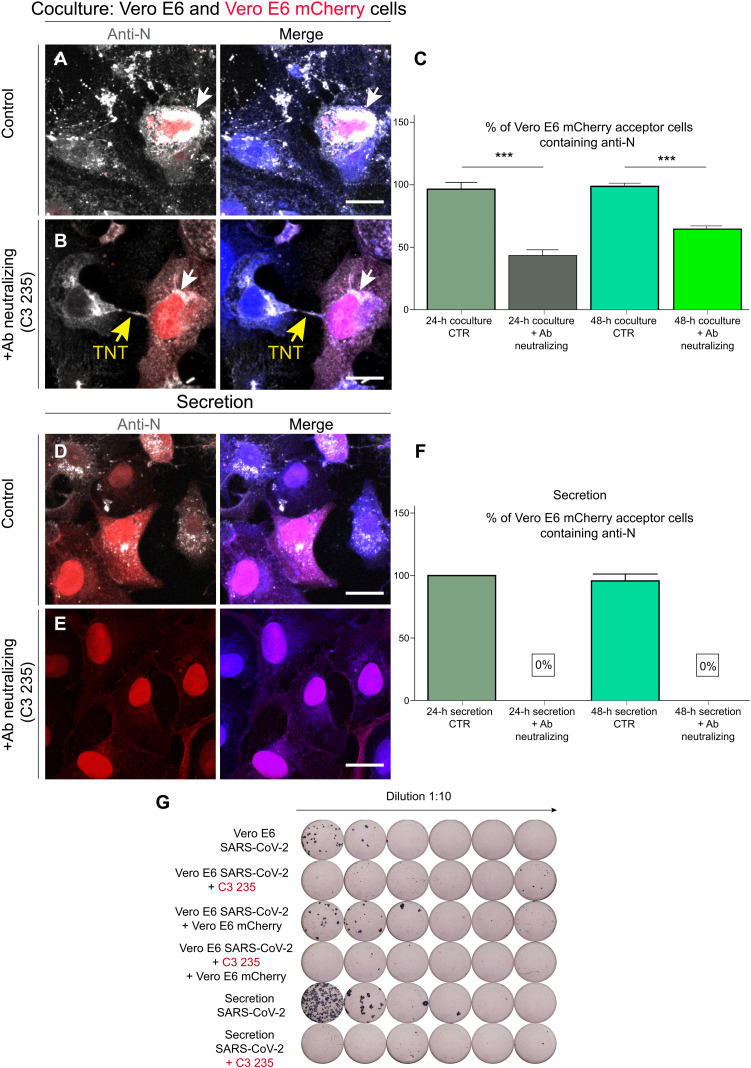
Fig. 4. SARS-CoV-2 viral particles spread between permissive cells through TNTs.
(A) Donor infected Vero E6 cells were put in coculture at 1:1 ratio with Vero E6 mCherry acceptors under control conditions (without neutralizing antibody) and (B) under neutralizing conditions. (B) Donor infected Vero E6 cells were incubated with the anti–SARS-CoV-2 IgG C3 235 before being cocultured with Vero E6 mCherry acceptors cells. The cocultures were fixed after 48 hours of incubation and immunostained with anti-N antibody (Ab) to detect SARS-CoV-2. Cellular cytoplasm was labeled with CellMask Blue. (C) Graph showing the mean percentage of anti-N puncta transferred in coculture at 24 and 48 hours, treated and not with the neutralizing antibody. The white arrows indicate SARS-CoV-2 anti-N signal, and the yellow arrows point to the TNT. CTR, control. (D) Vero E6 mCherry cells were incubated with the supernatant deriving from donor infected Vero E6 cells. (E) The supernatant from donor infected Vero E6 cells was incubated with the anti–SARS-CoV-2 IgG C3 235, to neutralize the viral particles, before being added on top of Vero E6 mCherry acceptor cells. After 48 hours of incubation, the secretion samples were fixed and immunostained for anti-N. (F) Graph showing the mean percentage of anti-N puncta contained in acceptor cells in the secretion experiments at 24 and 48 hours, treated or not with the neutralizing antibody. (G) The supernatant of each condition was then collected to assess viral neutralization using the focus-forming assay titration protocol. Scale bars, 20 μm (A, B, D, and E).

