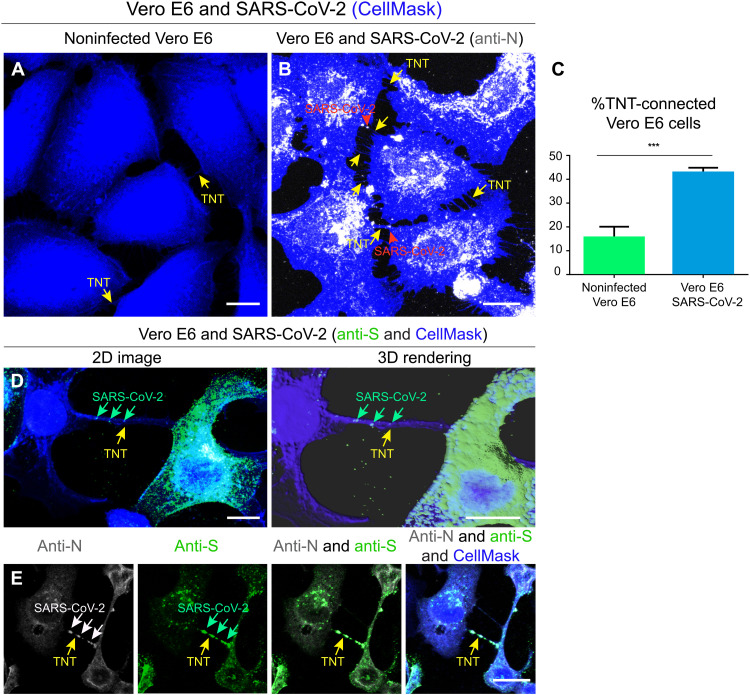
Fig. 5. SARS-CoV-2 infection increases the number of TNTs between infected Vero E6 cells.
(A) Confocal micrograph showing TNTs between noninfected Vero E6 cells. (B) Confocal micrograph showing TNTs between SARS-CoV-2–infected Vero E6 cells. Anti-N immunostaining is performed to detect SARS-CoV-2. Cellular cytoplasm and TNTs were labeled with CellMask Blue. The yellow arrows indicate TNTs between Vero E6 cells; the red arrowheads indicate the SARS-CoV-2 signal associated with TNTs. (C) Graph showing the percentage of TNT-connected cells between Vero E6 cells that are noninfected and SARS-CoV-2–infected. Mean percentage of TNT-connected Noninfected Vero E6 cells: 13.95% ± 2.46. Mean percentage of TNT-connected SARS-CoV-2–infected Vero E6 cells: 44.69% ± 1.96 (***P = 0.0006 for SARS-CoV-2–infected Vero E6 cells versus noninfected Vero E6 cells; n = 3). (D) Confocal micrograph and 3D rendering showing TNTs between SARS-CoV-2–infected Vero E6 cells; an anti-S immunostaining was performed to detect SARS-CoV-2. Cellular cytoplasm and TNTs were labeled with CellMask Blue. The yellow arrows indicate a TNT between infected Vero E6 cells; the green arrows indicate SARS-CoV-2 associated with a TNT. (E) Confocal micrograph showing TNTs between SARS-CoV-2–infected Vero E6 cells labeled with CellMask Blue. Anti-N (633) and anti-S (488) immunostaining was performed to detect SARS-CoV-2. The yellow arrows indicate a TNT between infected Vero E6 cells; the white and the green arrows indicate SARS-CoV-2 particles inside TNTs. Scale bars, 15 μm (A, B, and E) and 10 μm (C).

