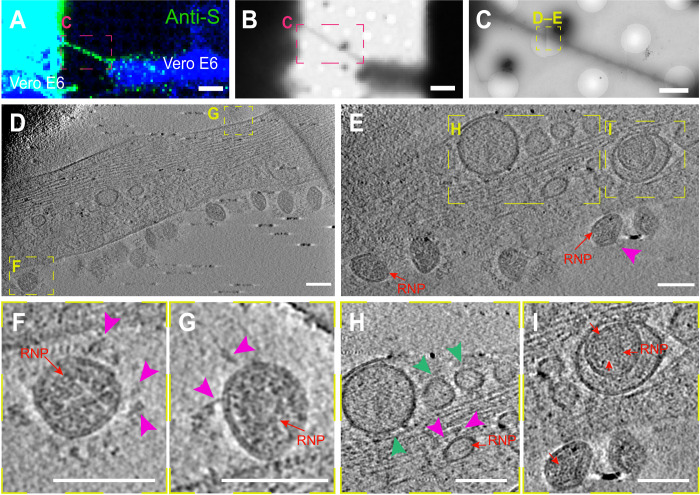
Fig. 7. Correlative IF cryo-EM reveals SARS-CoV-2 localization in TNTs.
(A to H) Cryo-EM grids were prepared using infected Vero E6 cells stained with anti-S antibody. (A) Confocal micrograph showing TNT connecting infected Vero E6 cells stained with anti-S antibody (green) and CellMask Blue (in pink dashed square). Low (B) and intermediate (C) magnification TEM of (A). (D and E) High-magnification cryo-ET slices of the yellow dashed square in (C) showing vesicular compartments in correspondence of anti-S signal and SARS-CoV-2 virions inside and on the TNT surface. (F and G) Enlargement of the high-magnification cryo-ET slices (D and E) and movie S6 showing SARS-CoV-2 virions on the TNT surface. (H) Enlargement of the high-magnification cryo-ET slices (D1) showing TNTs containing small vesicular structures (diameter of 50 to 100 nm) and a virus-like structure in which RNPs and S-like structures are observed. (I) Enlargement of the high-magnification cryo-ET slices (D1) showing virus-like structures inside a larger vesicle where we could discern the RNP. Pink arrowheads indicate S-like structures, red arrows point the RNPs, and green arrowheads indicate small vesicles. Scale bars, 15 μm (A and B), 2 μm (C), and 100 nm (D to H).

