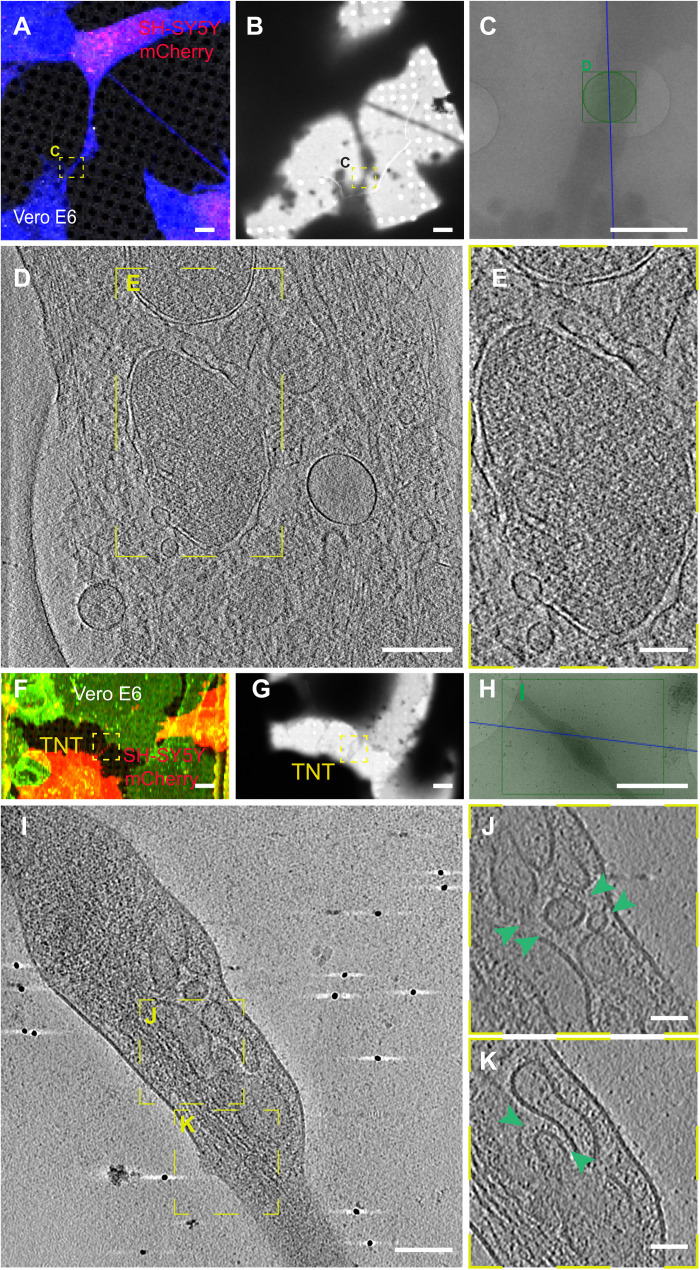
Fig. 8. Ultrastructural analysis reveals SARS-CoV-2 compartments inside TNTs between permissive Vero E6 cells and nonpermissive SH-SY5Y neuronal cells.
(A) Confocal micrographs showing a TNT connecting SARS-CoV-2–infected Vero E6 cells and SH-SY5Y mCherry cells stained with CellMask Blue. (B) Low and (C) intermediate magnification of an electron micrograph displaying TNT in (A). Green square in (C) corresponds to the high-magnification of cryo-ET slices in (D) showing a TNT containing vesicular compartments and DMVs. (E) Enlargement of cryo-ET slices in (D). (F to K) Cryo-EM grids were prepared using infected Vero E6 cells cocultured with SH-SY5Y mCherry cells and stained with WGA-488. (F) TNT between SARS-CoV-2–infected Vero E6 cells and SH-SY5Y mCherry cells acquired by confocal microscopy (F), with low (G) and intermediate (H) magnification TEM. (I) Slices of tomograms of TNT in the green rectangle in (H) showing vesicular compartments inside TNT. (J and K) High-magnification cryo-ET slices corresponding to the yellow dashed squares showing vesicular compartments inside TNT. The green arrowheads indicate the vesicles inside TNT. Scale bars, 2 μm (A to C and F to H), 200 nm (D), 300 nm (E), 100 nm (I), and 50 nm (J and K).

