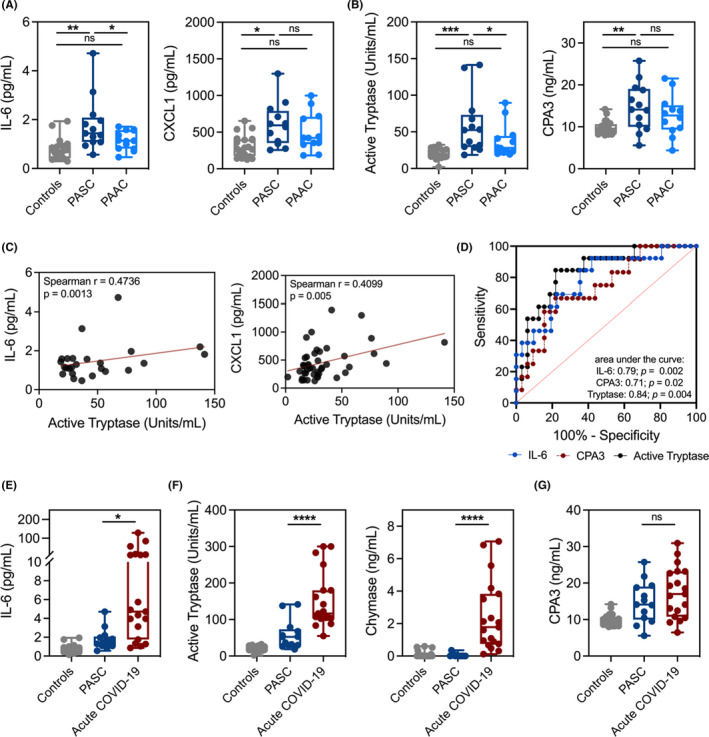
FIGURE 1.

PASC patient sera display a distinct profile of elevated inflammatory cytokines and mast cell‐derived proteases. (A–B) Cytokines, chemokines, or mast cell‐derived proteases in sera from symptomatic PASC (dark blue; n = 13), PAAC (light blue; n = 13), or control (gray; n = 19–20) groups. (C) Spearman correlations for levels of active tryptase, IL‐6 and CXCL1 from panels A, B. (D) ROC curves for active tryptase, CPA3, and IL‐6 using PASC versus PAAC and controls. (E–G) Levels of cytokines and mast cell‐derived proteases in sera from PASC patients (light blue; n = 13), acute COVID‐19 patients (red; n = 19), or controls (gray; n = 19–20). *P < 0.05;**P < 0.01;***P < 0.001;****P < 0.0001; ns=not significant; PAAC, post‐acute asymptomatic COVID‐19; PASC, post‐acute sequelae of COVID‐19
