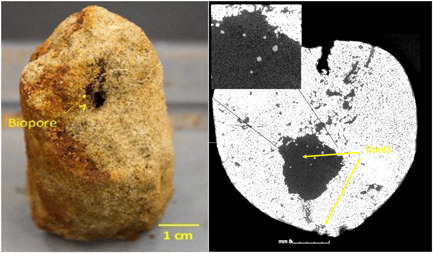
Figure 2.

Example of biopore development in a sandy loam soil from 60 to 70 cm soil depth with roots clearly visible entering a biopore (left) and shown clustered in a biopore (right) from an X‐ray computed tomography image taken in cross section (x–y plane; inset shows roots at higher magnification). Resolution = 20 µm. Adapted from Zhou et al. (2021) [Color figure can be viewed at wileyonlinelibrary.com]
