
Figure 3.
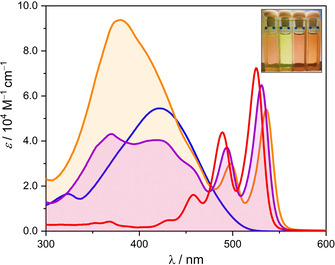
UV/Vis absorption spectra (c 0=10−6 M) of 5T‐PBI (purple line), (5T)2‐PBI (orange line), 5T (blue line) and Ref‐PBI (red line) in CH2Cl2 at room temperature. Inset: Photograph of Ref‐PBI, 5T, 5T‐PBI and (5T)2‐PBI (from left to right) in CH2Cl2.