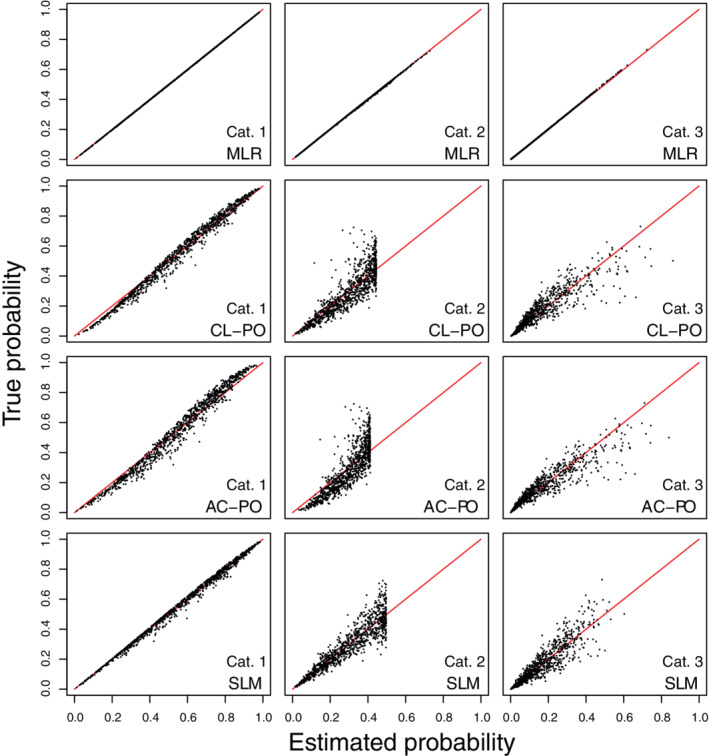
FIGURE 4.

Scatter plots of true risks vs estimated risks for simulation scenario 4 when the true model has the form of a multinomial logistic regression. The plots are based on a random subset of 1000 cases from all 200 000 cases. AC‐PO, adjacent category logit model with proportional odds; CL‐PO, cumulative logit model with proportional odds; MLR, multinomial logistic regression; SLM, stereotype logit model
