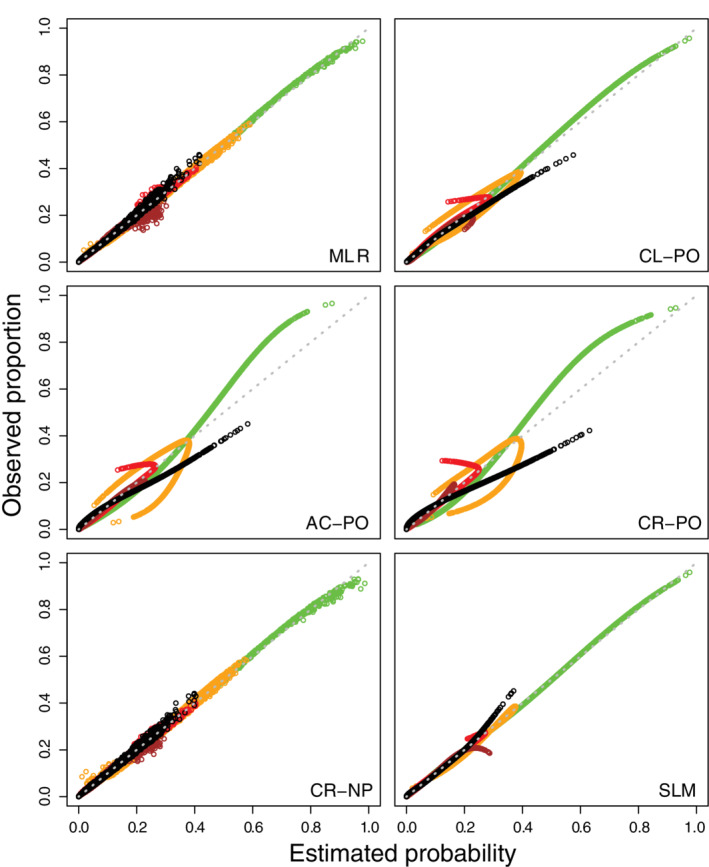
FIGURE 9.

Calibration scatter plots per outcome category for the models in the case study (green for no coronary artery disease, orange for nonobstructive stenosis, red for one‐vessel disease, brown for two‐vessel disease, black for three‐vessel disease). These plots are generated for the model development data (ie, apparent validation, n = 4888). AC‐PO, adjacent category logit model with proportional odds; CL‐PO, cumulative logit model with proportional odds; CR‐NP, continuation ratio logit model without proportional odds; CR‐PO, continuation ratio logit model with proportional odds; MLR, multinomial logistic regression; SLM, stereotype logit model
