FIGURE 3.

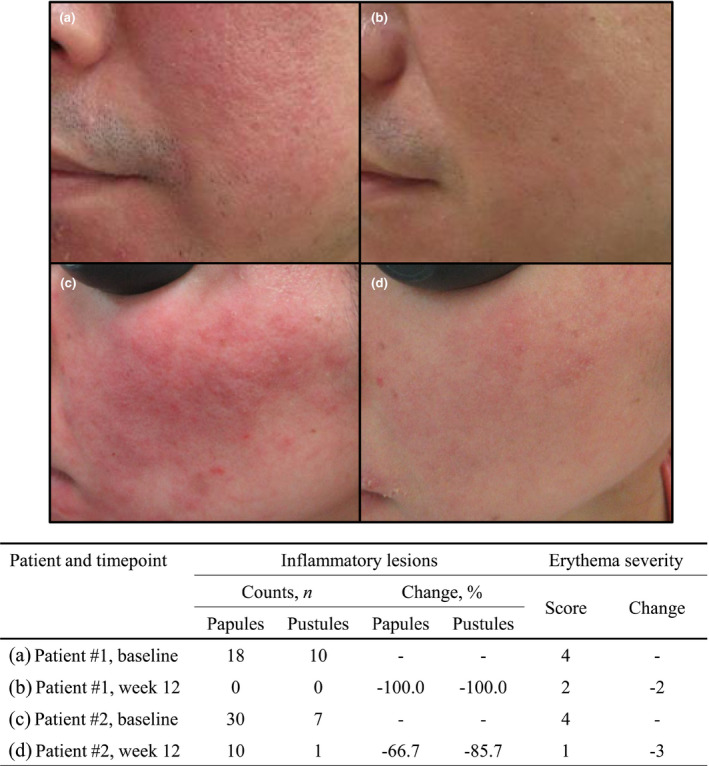
Example of response to treatment. (a) Patient #1 at baseline; (b) patient #1 at week 12; (c) patient #2 at baseline; (d) patient #2 at week 12

Example of response to treatment. (a) Patient #1 at baseline; (b) patient #1 at week 12; (c) patient #2 at baseline; (d) patient #2 at week 12