Figure 2.

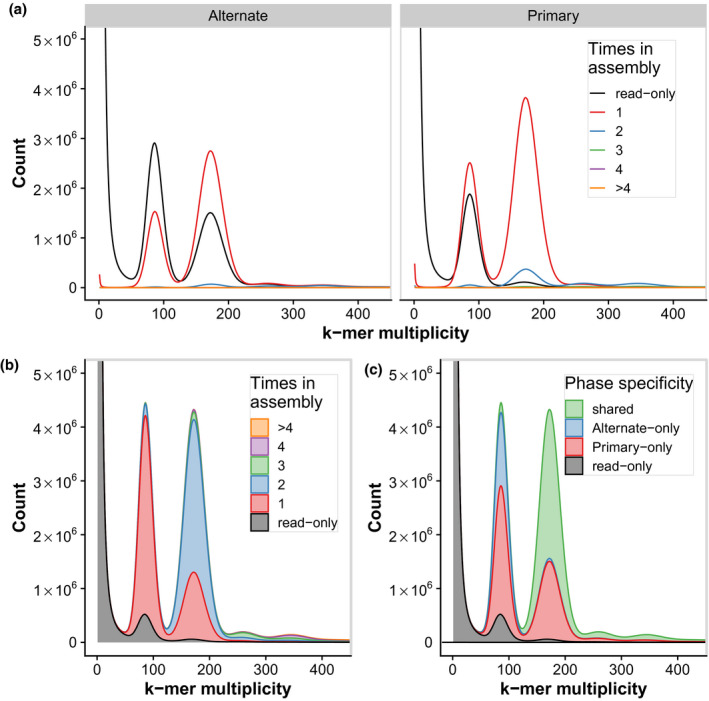
K‐mer copy number and assembly analyses for the final phased TME7 assemblies.
(a) K‐mer count spectra for the alternate (haplotigs) and primary assemblies after phasing.
(b) Diploid (primary + haplotigs) k‐mer count spectra. In both (a) and (b), short read k‐mer distribution plots are colored by the number of times a k‐mer is present in the assembly. K‐mers denoted in gray are missing from the assembly and represent probable short‐read sequencing errors (k‐mer multiplicity <50) or missing assembled sequence (≥50).
(c) Assembly spectra of the diploid assembly suggest that most homozygous k‐mers (approximately 200× peak) are shared between the assemblies, while most of the heterozygous (approximately 100× peak) k‐mers are phase specific.
