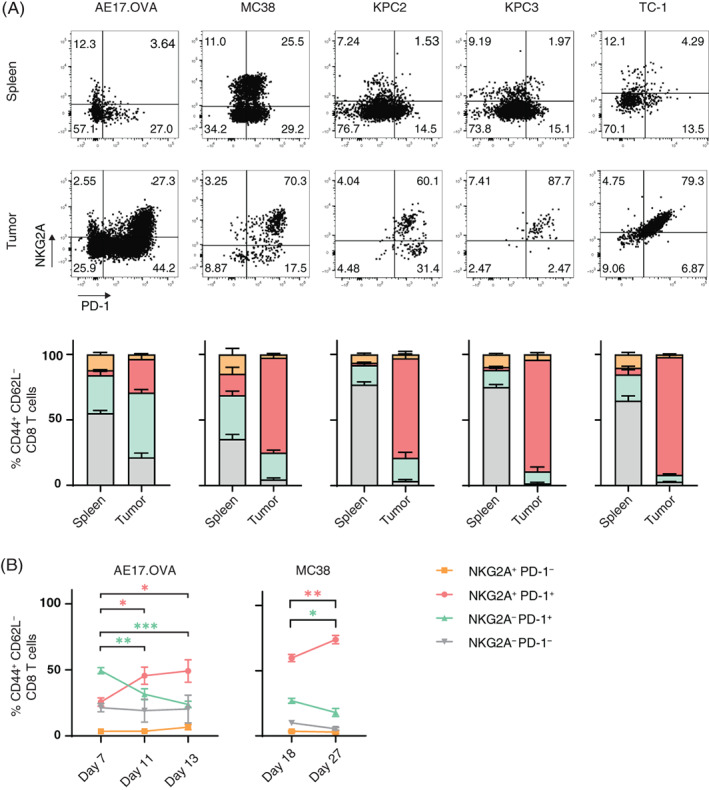
FIGURE 1.

The fraction of NKG2A‐positive CD8 TIL increases over time. (A) Representative flow cytometry plots and quantification of CD8 T cells expressing NKG2A and PD‐1. Tumors and spleens of untreated C57BL/6 mice were harvested, dispersed and stained for flow cytometry. Frequencies of activated CD8 T cells (CD44+CD62L−) expressing NKG2A and/or PD‐1 are depicted from AE17.OVA mesothelioma (n = 6), MC38 colon carcinoma (n = 6), two independent KPC pancreas carcinomas (n = 5) and HPV16‐induced TC‐1 tumors (n = 5). Proportion of CD3+CD8+ T cells with the CD44+CD62L− phenotype was much higher in tumors than in spleens (Figure S5). Data presented are means ± SEM. (B) Dynamics of CD8 T cell subsets in AE17.OVA (n = 6) and MC38 (n = 6) tumor models. Four subsets were plotted over time. One‐way ANOVA with Holm‐Sidak's multiple comparisons test was used for statistical analysis [Color figure can be viewed at wileyonlinelibrary.com]
