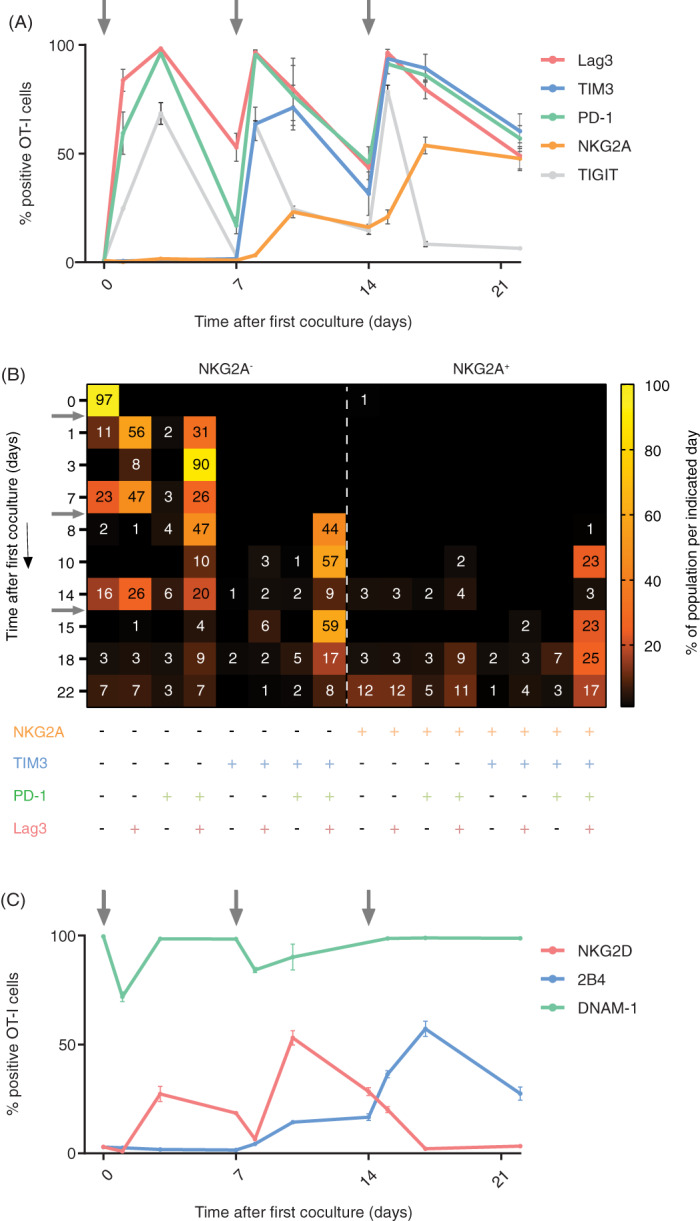
FIGURE 3.

NKG2A expression in relation to other inhibiting and activating receptors. (A) Dynamic expression profiles of multiple inhibition receptors on OT‐I T cells after synchronous activation in the in vitro culture system, depicted in Figure 2A. Means and SD of triplicates from one representative out of five independent experiments are shown. (B) Heatmap of coexpression profiles of inhibition receptors from one representative experiment. Dynamics of 16 OT‐I populations based on Boolean gating. Shown are the percentages (only values >1 are depicted) of OT‐I T cells positive for the indicated receptors. Arrows indicate stimulations with SAMBOK cells. (C) Dynamic expression profiles of three activating receptors on OT‐I T cells from one representative out of three independent experiments. Data presented are means with SD of triplicates [Color figure can be viewed at wileyonlinelibrary.com]
