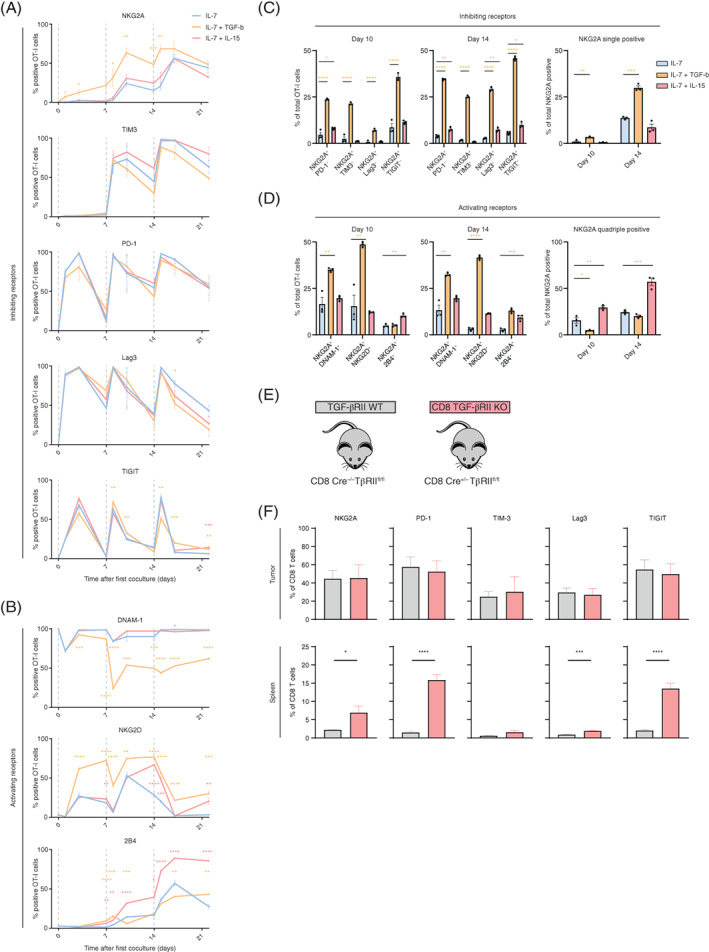
FIGURE 4.

TGF‐β, but not IL‐15, enhances NKG2A expression on activated OT‐I T cells. OT‐I T cells were synchronously activated with SAMBOK cells, according to Figure 2A and then incubated in the presence of IL‐7 alone or in combination with 10 ng/mL IL‐15 or 5 ng/mL TGF‐β. (A‐B) Line graphs show the frequency of OT‐I T cells expressing (A) inhibiting receptors (n = 5) and (B) activating receptors (n = 3). Means and SEM of independent experiments are depicted. (C and D) Quantification of coexpression of (C) inhibiting receptors (n = 5) and (D) activating receptors (n = 3) in the several culture conditions. Data presented are means and SEM of independent experiments. One‐way ANOVA with Dunnett's multiple comparisons test was used for statistical analysis at the indicated time points. Color reflects cytokine condition compared to IL‐7 alone. (E and F) TGF‐βRII WT and CD8 TGF‐βRII KO (lacking the TGF‐β receptor II selectively in CD8 T cells) mice were inoculated with KPC3 tumors, which were 20 days later harvested together with spleens, dispersed and stained for flow cytometry. Data presented are means and SEM of four individual mice. Unpaired Student's t test for statistical analysis [Color figure can be viewed at wileyonlinelibrary.com]
