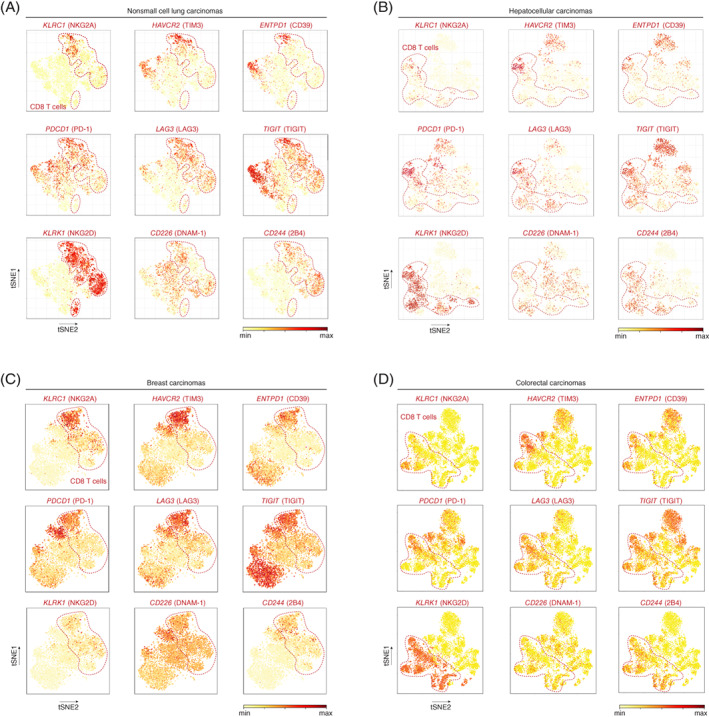
FIGURE 6.

Cluster analysis and expression levels of single cell transcriptomes of (A) 14 nonsmall cell lung carcinomas 29 (9055T cells from blood and tumor), (B) 5 hepatocellular carcinomas 30 (4070T cells from blood and tumor), (C) 2 breast carcinomas 32 (5759T cells from blood and tumor) and (D) 12 colorectal carcinomas 31 (11138T cells from peripheral blood, adjacent normal and tumor tissues) [Color figure can be viewed at wileyonlinelibrary.com]
