FIGURE 7.

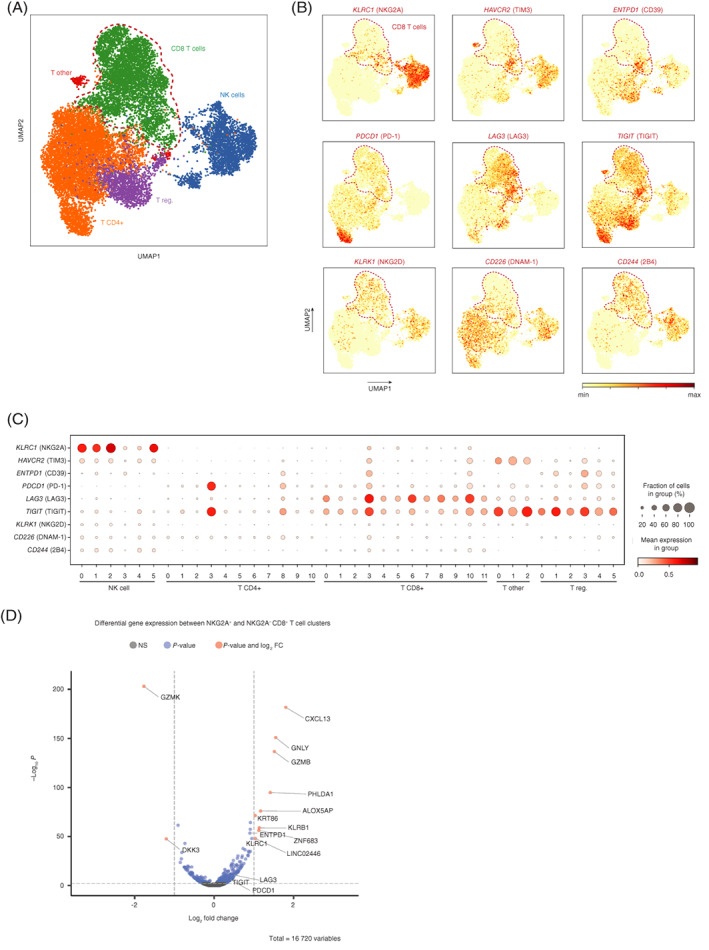
Restricted distribution of NKG2A within CD8 TIL clusters in head and neck carcinoma. (A) Two‐dimensional UMAP plots displaying single cell transcriptomes of 14242T cells and 2820 NK cells from 13 untreated oropharyngeal squamous cell carcinomas. Each dot represents a single cell and red dotted line denote CD8 TIL. (B) Expression levels of surface immune receptors are depicted in color code. (C) Clusters of TIL were analyzed for transcript levels of indicated receptors. (D) Volcano plot of differentially expressed genes on CD8 TIL clusters 3 and 10 compared to all other CD8 TIL clusters. Shown are Benjamini‐Hochberg adjusted P‐values [Color figure can be viewed at wileyonlinelibrary.com]
