
FIGURE 1.
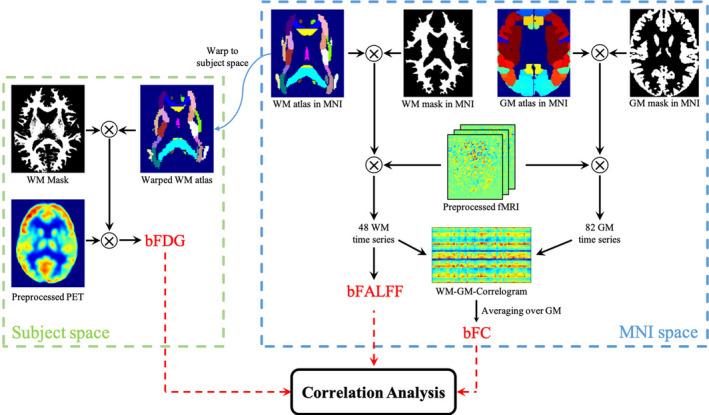
Schematic diagram of analysis framework. PET recordings are processed in the native space of each individual subject, from which bFDG is derived for each WM bundle by referencing the JHU‐ICBM WM atlas that is warped into the subject space. Meanwhile, BOLD signals are processed in the MNI space. To compute bFC, the brain is parcellated into 48 WM bundles and 82 GM regions, using the JHU‐ICBM atlas and BAs definitions, respectively. The coefficient of Pearson correlation in BOLD time series between each pair of WM bundle and GM region is calculated to obtain a WM‐GM correlogram, from which mean bFC of each WM bundle is derived by averaging over the 82 GM regions. A second measure of WM function, bFALFF, is derived for each WM bundle directly from the BOLD time series by referencing the JHU‐ICBM atlas. Finally, pair‐wise correlations are sought among the three measures derived